Crime rate in Dickson, Oklahoma (OK): murders, rapes, robberies, assaults, burglaries, thefts, auto thefts, arson, law enforcement employees, police officers, crime map
Crime rate in Dickson, OK
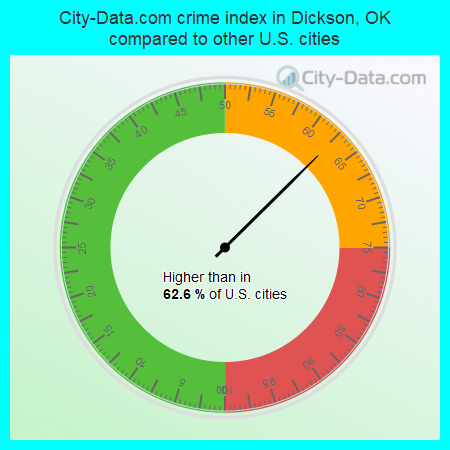
The 2022 crime rate in Dickson, OK is 142 (City-Data.com crime index), which is 1.7 times smaller than the U.S. average. It was higher than in 62.6% U.S. cities. The 2022 Dickson crime rate fell by 31% compared to 2021. In the last 5 years Dickson has seen increasing violent crime and rise of property crime.See how dangerous Dickson, OK is compared to the nearest cities:
(Note: Higher means more crime)
(Note: Higher means more crime)
| Dickson: | 142.2 |
| Ardmore: | 408.6 |
| Madill: | 172.2 |
| Lone Grove: | 146.6 |
| Tishomingo: | 96.2 |
| Marietta: | 306.3 |
| Kingston: | 134.4 |
| Sulphur: | 162.2 |
| Davis: | 363.1 |
Type |
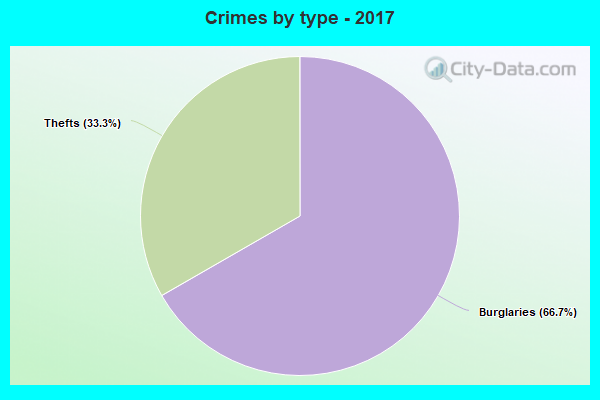
2017 |
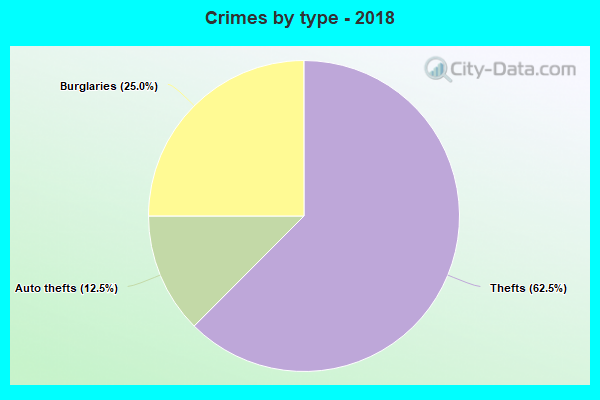
2018 |
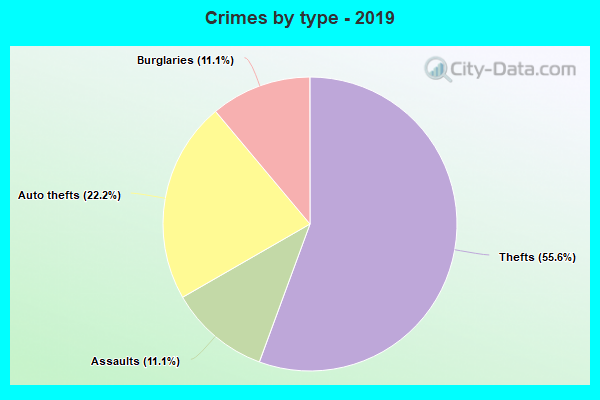
2019 |
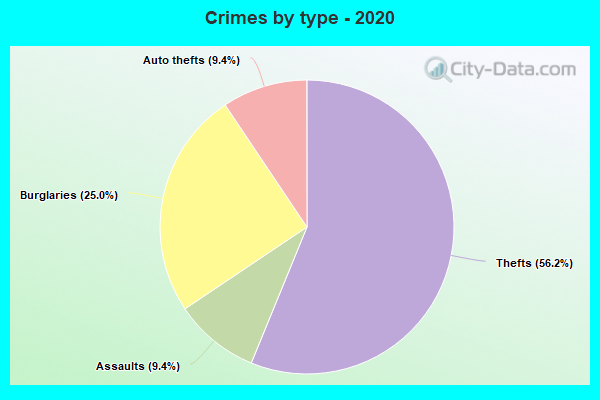
2020 |
2021 |
2022 |
|---|---|---|---|---|---|---|
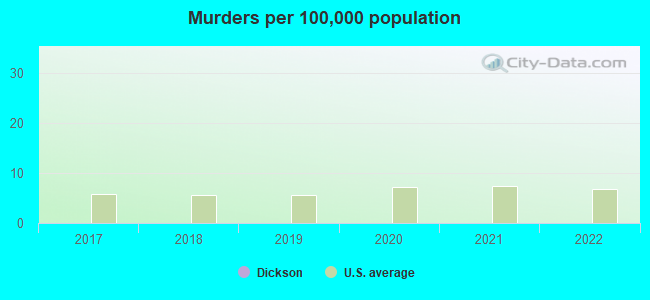
| Murders (per 100,000) | 0 (0.0) | 0 (0.0) | 0 (0.0) | 0 (0.0) | 0 (0.0) | 0 (0.0) |
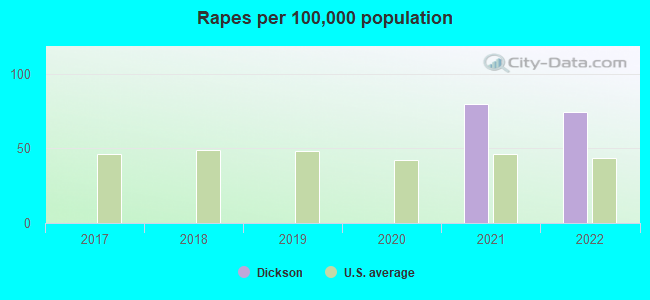
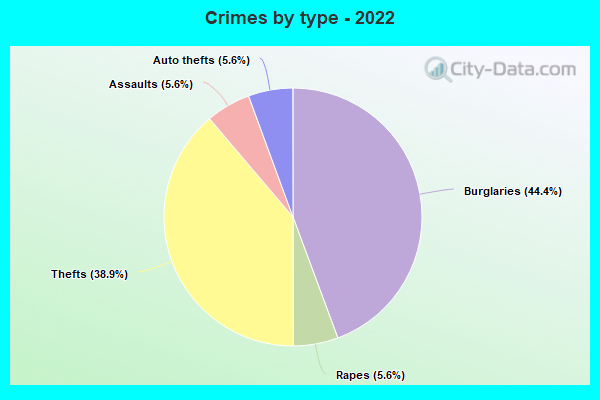
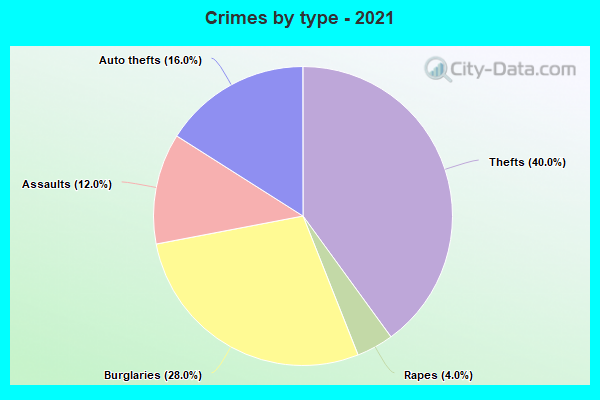
| Rapes (per 100,000) | 0 (0.0) | 0 (0.0) | 0 (0.0) | 0 (0.0) | 1 (79.4) | 1 (74.1) |
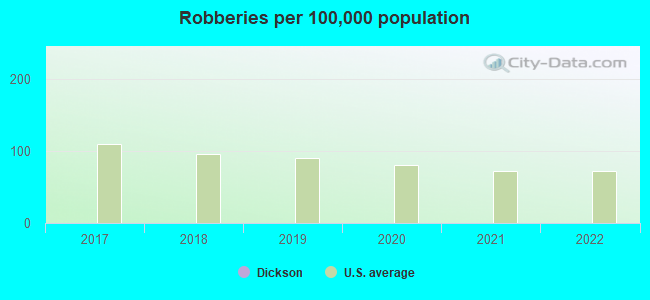
| Robberies (per 100,000) | 0 (0.0) | 0 (0.0) | 0 (0.0) | 0 (0.0) | 0 (0.0) | 0 (0.0) |
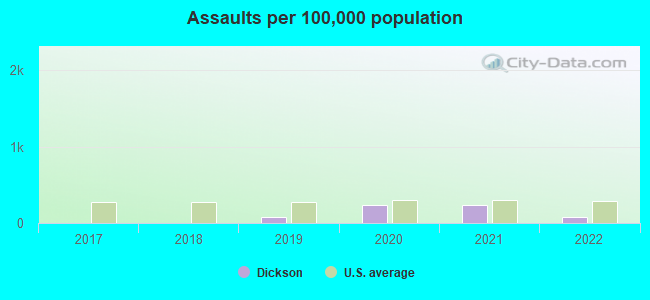
| Assaults (per 100,000) | 0 (0.0) | 0 (0.0) | 1 (79.9) | 3 (239.6) | 3 (238.1) | 1 (74.1) |
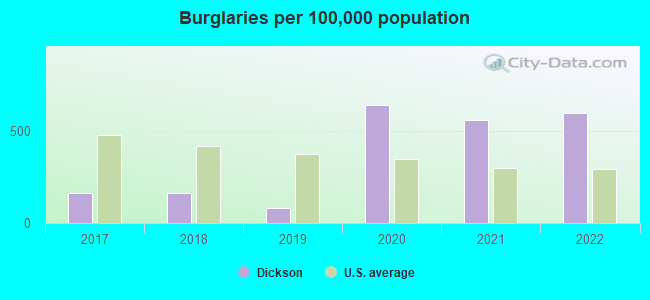
| Burglaries (per 100,000) | 2 (159.6) | 2 (159.7) | 1 (79.9) | 8 (639.0) | 7 (555.6) | 8 (592.6) |
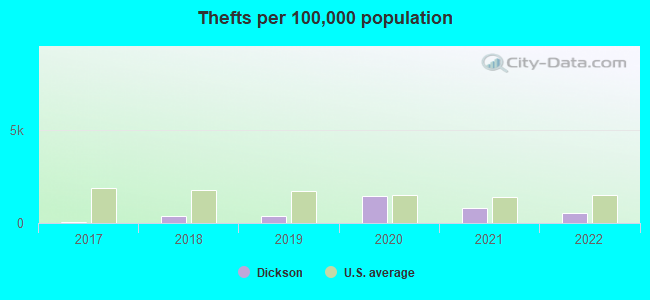
| Thefts (per 100,000) | 1 (79.8) | 5 (399.4) | 5 (399.7) | 18 (1,438) | 10 (793.7) | 7 (518.5) |
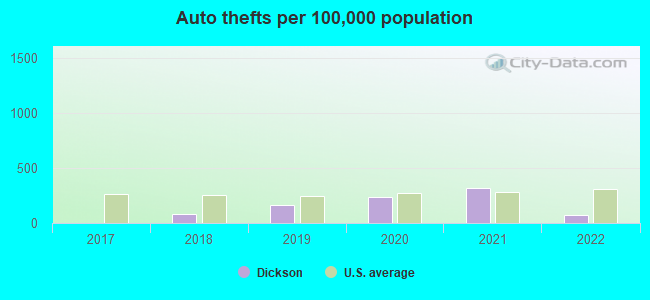
| Auto thefts (per 100,000) | 0 (0.0) | 1 (79.9) | 2 (159.9) | 3 (239.6) | 4 (317.5) | 1 (74.1) |
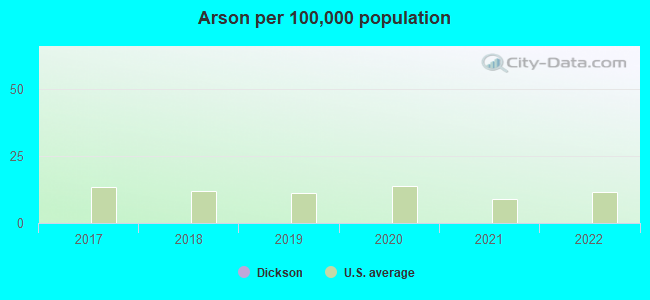
| Arson (per 100,000) | 0 (0.0) | 0 (0.0) | 0 (0.0) | 0 (0.0) | 0 (0.0) | 0 (0.0) |
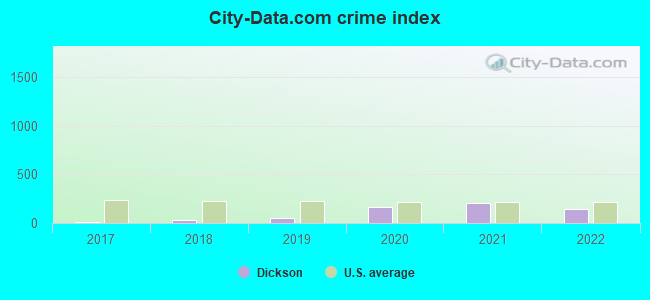
| City-Data.com crime index | 14.4 | 33.5 | 50.4 | 169.3 | 207.1 | 142.2 |
The City-Data.com crime index weighs serious crimes and violent crimes more heavily. Higher means more crime, U.S. average is 246.1. It adjusts for the number of visitors and daily workers commuting into cities.
Violent crime rate in 2022
| Dickson: | 111.1 |
| U.S. Average: | 219.8 |
Violent crime rate in 2021
| Dickson: | 198.4 |
| U.S. Average: | 224.8 |
Violent crime rate in 2020
| Dickson: | 119.8 |
| U.S. Average: | 228.2 |
Violent crime rate in 2019
| Dickson: | 40.0 |
| U.S. Average: | 219.9 |
Violent crime rate in 2018
| Dickson: | 0.0 |
| U.S. Average: | 221.2 |
Violent crime rate in 2017
| Dickson: | 0.0 |
| U.S. Average: | 226.2 |
Property crime rate in 2022
| Dickson: | 155.6 |
| U.S. Average: | 166.5 |
Property crime rate in 2021
| Dickson: | 198.4 |
| U.S. Average: | 157.8 |
Property crime rate in 2020
| Dickson: | 235.6 |
| U.S. Average: | 169.6 |
Property crime rate in 2019
| Dickson: | 60.0 |
| U.S. Average: | 179.7 |
Property crime rate in 2018
| Dickson: | 63.9 |
| U.S. Average: | 190.2 |
Property crime rate in 2017
| Dickson: | 35.9 |
| U.S. Average: | 206.4 |
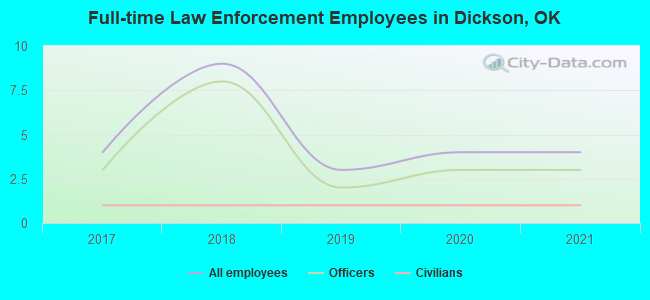
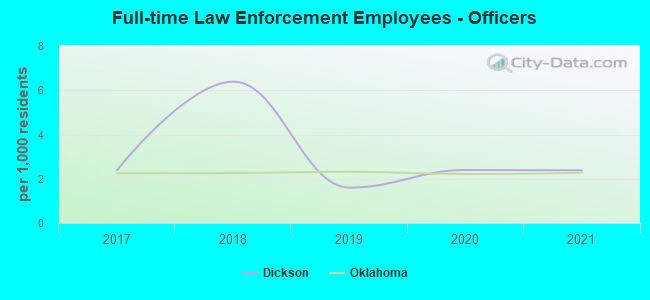
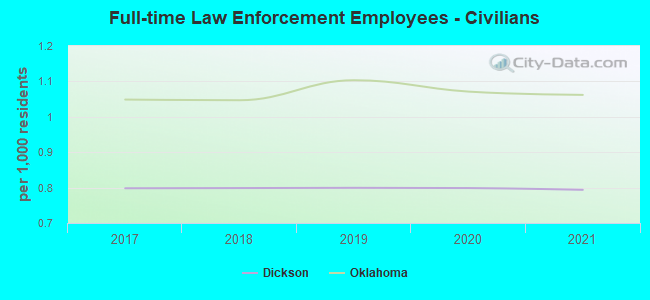
Full-time law enforcement employees in 2021, including police officers: 4 (3 officers - 3 male; 0 female).
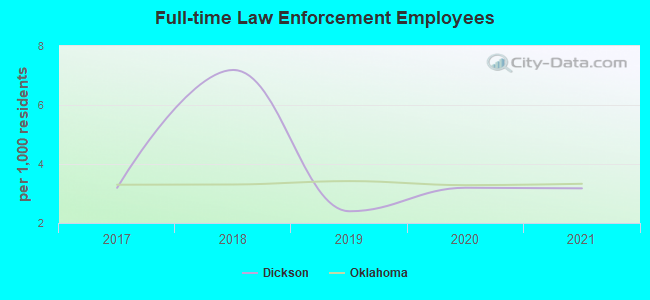
| Officers per 1,000 residents here: | 2.38 |
| Oklahoma average: | 2.27 |
Full-time law enforcement employees in 2020, including police officers: 4 (3 officers - 3 male; 0 female).
| Officers per 1,000 residents here: | 2.40 |
| Oklahoma average: | 2.21 |
Full-time law enforcement employees in 2019, including police officers: 3 (2 officers - 2 male; 0 female).
| Officers per 1,000 residents here: | 1.60 |
| Oklahoma average: | 2.32 |
Full-time law enforcement employees in 2018, including police officers: 9 (8 officers - 7 male; 1 female).
| Officers per 1,000 residents here: | 6.39 |
| Oklahoma average: | 2.26 |
Full-time law enforcement employees in 2017, including police officers: 4 (3 officers - 2 male; 1 female).
| Officers per 1,000 residents here: | 2.39 |
| Oklahoma average: | 2.25 |
Zip codes: 73401.