Crime rate in Hunting Valley, Ohio (OH): murders, rapes, robberies, assaults, burglaries, thefts, auto thefts, arson, law enforcement employees, police officers, crime map
Type |
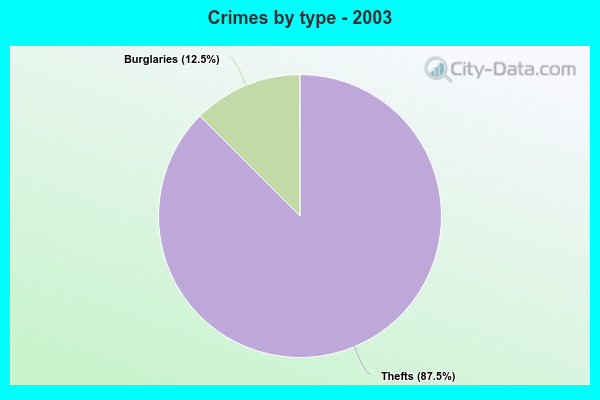
2003 |
2004 |
2005 |
2006 |
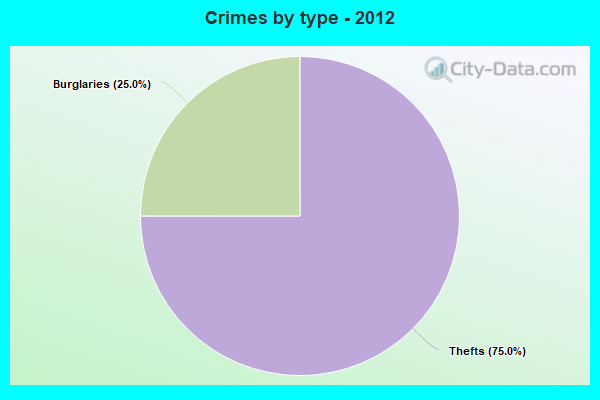
2012 |
2013 |
|---|---|---|---|---|---|---|
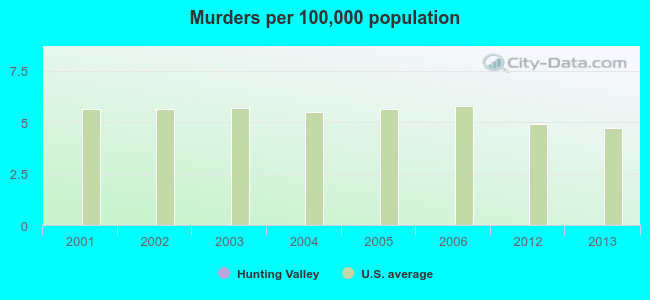
| Murders (per 100,000) | 0 (0.0) | 0 (0.0) | 0 (0.0) | 0 (0.0) | 0 (0.0) | 0 (0.0) |
| Rapes (per 100,000) | 0 (0.0) | 0 (0.0) | 0 (0.0) | 0 (0.0) | 0 (0.0) | 0 (0.0) |
| Robberies (per 100,000) | 0 (0.0) | 0 (0.0) | 0 (0.0) | 0 (0.0) | 0 (0.0) | 0 (0.0) |
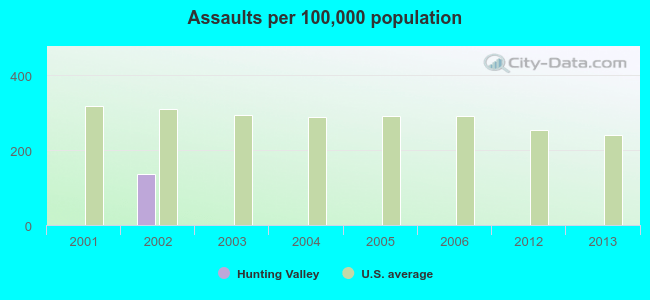
| Assaults (per 100,000) | 0 (0.0) | 0 (0.0) | 0 (0.0) | 0 (0.0) | 0 (0.0) | 0 (0.0) |
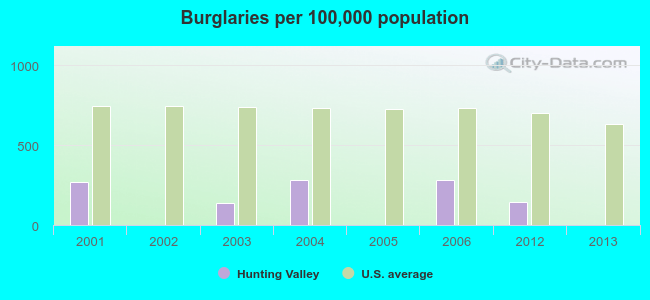
| Burglaries (per 100,000) | 1 (137.4) | 2 (278.6) | 0 (0.0) | 2 (280.9) | 1 (142.9) | 0 (0.0) |
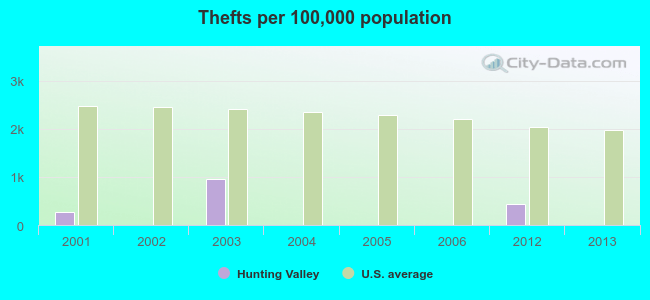
| Thefts (per 100,000) | 7 (961.5) | 0 (0.0) | 0 (0.0) | 0 (0.0) | 3 (428.6) | 0 (0.0) |
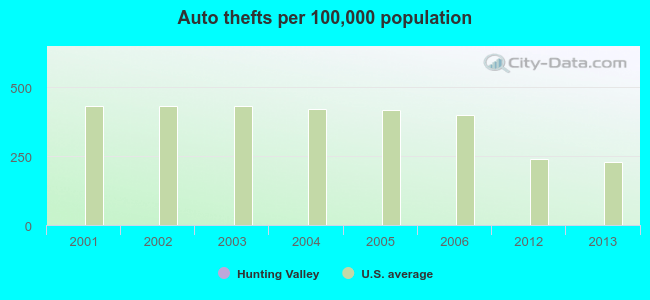
| Auto thefts (per 100,000) | 0 (0.0) | 0 (0.0) | 0 (0.0) | 0 (0.0) | 0 (0.0) | 0 (0.0) |
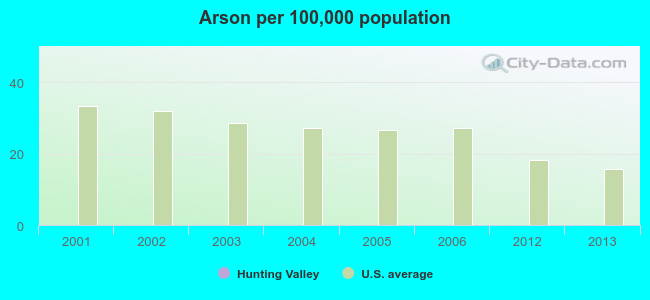
| Arson (per 100,000) | 0 (0.0) | 0 (0.0) | 0 (0.0) | 0 (0.0) | 0 (0.0) | 0 (0.0) |
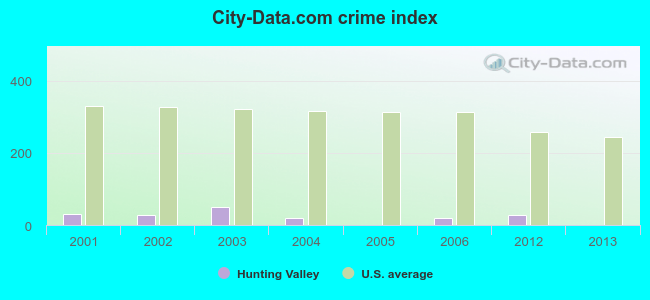
| City-Data.com crime index (higher means more crime, U.S. average = 280.6) | 49.4 | 19.5 | 0.0 | 19.7 | 27.1 | 0.0 |
The City-Data.com crime rate weighs serious crimes and violent crimes more heavily. It adjusts for the number of visitors and daily workers commuting into cities.
Violent crime rate in 2013
| Hunting Valley: | 0.0 |
| U.S. Average: | 204.3 |
Violent crime rate in 2012
| Hunting Valley: | 0.0 |
| U.S. Average: | 214.5 |
Violent crime rate in 2006
| Hunting Valley: | 0.0 |
| U.S. Average: | 264.1 |
Violent crime rate in 2005
| Hunting Valley: | 0.0 |
| U.S. Average: | 258.9 |
Violent crime rate in 2004
| Hunting Valley: | 0.0 |
| U.S. Average: | 256.0 |
Violent crime rate in 2003
| Hunting Valley: | 0.0 |
| U.S. Average: | 262.6 |
Violent crime rate in 2002
| Hunting Valley: | 69.5 |
| U.S. Average: | 272.2 |
Violent crime rate in 2001
| Hunting Valley: | 0.0 |
| U.S. Average: | 276.6 |
Property crime rate in 2013
| Hunting Valley: | 0.0 |
| U.S. Average: | 250.4 |
Property crime rate in 2012
| Hunting Valley: | 50.0 |
| U.S. Average: | 267.3 |
Property crime rate in 2006
| Hunting Valley: | 56.2 |
| U.S. Average: | 317.3 |
Property crime rate in 2005
| Hunting Valley: | 0.0 |
| U.S. Average: | 322.3 |
Property crime rate in 2004
| Hunting Valley: | 55.7 |
| U.S. Average: | 327.4 |
Property crime rate in 2003
| Hunting Valley: | 77.7 |
| U.S. Average: | 334.1 |
Property crime rate in 2002
| Hunting Valley: | 0.0 |
| U.S. Average: | 336.9 |
Property crime rate in 2001
| Hunting Valley: | 69.8 |
| U.S. Average: | 337.2 |


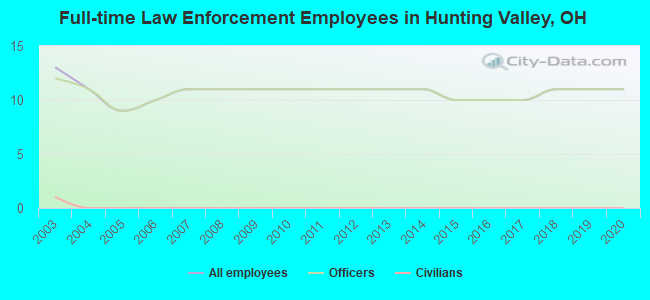
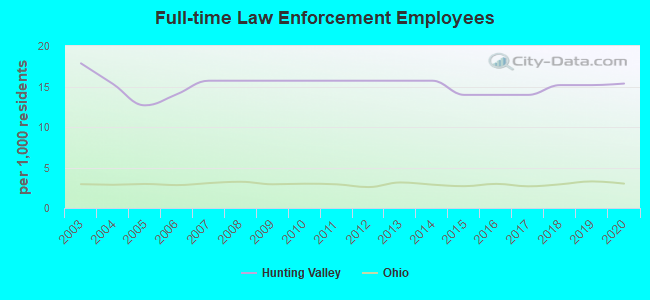
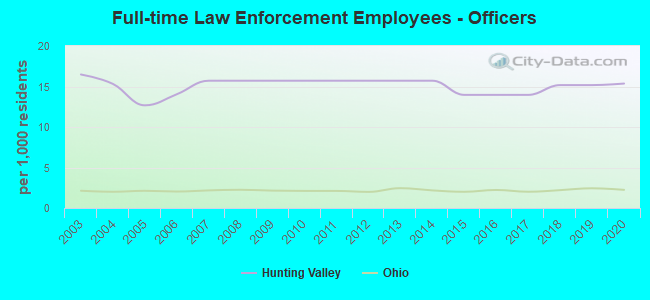
Full-time law enforcement employees in 2015, including police officers: 10 (10 officers).
| Officers per 1,000 residents here: | 13.97 |
| Ohio average: | 2.03 |
Full-time law enforcement employees in 2007, including police officers: 11 (11 officers).
| Officers per 1,000 residents here: | 15.71 |
| Ohio average: | 2.10 |
Full-time law enforcement employees in 2006, including police officers: 10 (10 officers).
| Officers per 1,000 residents here: | 13.61 |
| Ohio average: | 2.03 |
Full-time law enforcement employees in 2005, including police officers: 9 (9 officers).
| Officers per 1,000 residents here: | 12.24 |
| Ohio average: | 2.12 |
Full-time law enforcement employees in 2004, including police officers: 11 (11 officers).
| Officers per 1,000 residents here: | 14.97 |
| Ohio average: | 2.00 |
Full-time law enforcement employees in 2003, including police officers: 13 (12 officers).
| Officers per 1,000 residents here: | 16.33 |
| Ohio average: | 2.13 |
Zip codes: 44022.