Crime rate in Jackson, Mississippi (MS): murders, rapes, robberies, assaults, burglaries, thefts, auto thefts, arson, law enforcement employees, police officers, crime map

Crime rate in Jackson, MS
The 2020 crime rate in Jackson, MS is 620 (City-Data.com crime index), which is 2.5 times greater than the U.S. average. It was higher than in 98.3% U.S. cities. The 2020 Jackson crime rate rose by 12% compared to 2019. The number of homicides stood at 110 - an increase of 34 compared to 2019. In the last 5 years Jackson has seen increasing violent crime and decline of property crime.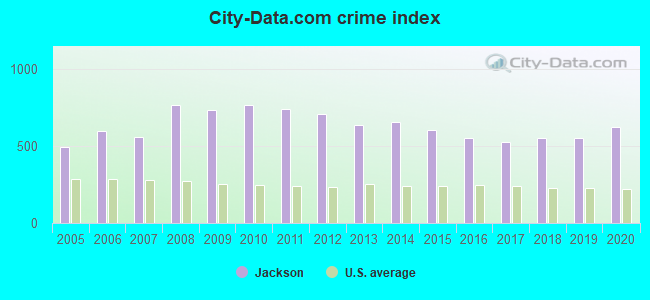
The City-Data.com crime index weighs serious crimes and violent crimes more heavily. Higher means more crime, U.S. average is 246.1. It adjusts for the number of visitors and daily workers commuting into cities.
- means the value is smaller than the state average.- means the value is bigger than the state average.
- means the value is much bigger than the state average.
According to our research of Mississippi and other state lists, there were 606 registered sex offenders living in Jackson, Mississippi as of April 26, 2024.
The ratio of all residents to sex offenders in Jackson is 284 to 1.
The ratio of registered sex offenders to all residents in this city is near the state average.
Violent crime rate in 2020
| Jackson: | 646.8 |
| U.S. Average: | 228.2 |
Violent crime rate in 2019
| Jackson: | 512.9 |
| U.S. Average: | 219.9 |
Violent crime rate in 2018
| Jackson: | 477.6 |
| U.S. Average: | 221.2 |
Violent crime rate in 2017
| Jackson: | 479.5 |
| U.S. Average: | 226.2 |
Violent crime rate in 2016
| Jackson: | 509.2 |
| U.S. Average: | 227.3 |
Violent crime rate in 2015
| Jackson: | 548.1 |
| U.S. Average: | 219.3 |
Violent crime rate in 2014
| Jackson: | 549.1 |
| U.S. Average: | 211.1 |
Violent crime rate in 2013
| Jackson: | 537.1 |
| U.S. Average: | 214.2 |
Violent crime rate in 2012
| Jackson: | 566.1 |
| U.S. Average: | 187.4 |
Violent crime rate in 2011
| Jackson: | 546.0 |
| U.S. Average: | 187.1 |
Violent crime rate in 2010
| Jackson: | 559.6 |
| U.S. Average: | 195.7 |
Violent crime rate in 2009
| Jackson: | 506.4 |
| U.S. Average: | 208.9 |
Violent crime rate in 2008
| Jackson: | 565.7 |
| U.S. Average: | 222.5 |
Violent crime rate in 2007
| Jackson: | 405.8 |
| U.S. Average: | 229.1 |
Violent crime rate in 2006
| Jackson: | 452.1 |
| U.S. Average: | 232.6 |
Violent crime rate in 2005
| Jackson: | 330.0 |
| U.S. Average: | 227.0 |
Property crime rate in 2020
| Jackson: | 409.4 |
| U.S. Average: | 169.6 |
Property crime rate in 2019
| Jackson: | 448.7 |
| U.S. Average: | 179.7 |
Property crime rate in 2018
| Jackson: | 487.5 |
| U.S. Average: | 190.2 |
Property crime rate in 2017
| Jackson: | 444.2 |
| U.S. Average: | 206.4 |
Property crime rate in 2016
| Jackson: | 454.9 |
| U.S. Average: | 216.6 |
Property crime rate in 2015
| Jackson: | 522.4 |
| U.S. Average: | 221.5 |
Property crime rate in 2014
| Jackson: | 623.4 |
| U.S. Average: | 230.8 |
Property crime rate in 2013
| Jackson: | 638.8 |
| U.S. Average: | 250.4 |
Property crime rate in 2012
| Jackson: | 744.9 |
| U.S. Average: | 267.3 |
Property crime rate in 2011
| Jackson: | 858.1 |
| U.S. Average: | 273.5 |
Property crime rate in 2010
| Jackson: | 887.9 |
| U.S. Average: | 276.4 |
Property crime rate in 2009
| Jackson: | 871.7 |
| U.S. Average: | 285.6 |
Property crime rate in 2008
| Jackson: | 843.0 |
| U.S. Average: | 302.2 |
Property crime rate in 2007
| Jackson: | 619.1 |
| U.S. Average: | 309.2 |
Property crime rate in 2006
| Jackson: | 636.3 |
| U.S. Average: | 317.3 |
Property crime rate in 2005
| Jackson: | 556.4 |
| U.S. Average: | 322.3 |


Full-time law enforcement employees in 2021, including police officers: 416 (278 officers - 197 male; 81 female).
| Officers per 1,000 residents here: | 1.78 |
| Mississippi average: | 2.18 |
Full-time law enforcement employees in 2016, including police officers: 641 (409 officers - 313 male; 96 female).
| Officers per 1,000 residents here: | 2.40 |
| Mississippi average: | 2.36 |
Full-time law enforcement employees in 2015, including police officers: 692 (415 officers - 319 male; 96 female).
| Officers per 1,000 residents here: | 2.43 |
| Mississippi average: | 2.28 |
Full-time law enforcement employees in 2014, including police officers: 692 (415 officers - 319 male; 96 female).
| Officers per 1,000 residents here: | 2.41 |
| Mississippi average: | 2.44 |
Full-time law enforcement employees in 2013, including police officers: 725 (442 officers - 350 male; 92 female).
| Officers per 1,000 residents here: | 2.51 |
| Mississippi average: | 2.40 |
Full-time law enforcement employees in 2012, including police officers: 746 (468 officers - 361 male; 107 female).
| Officers per 1,000 residents here: | 2.66 |
| Mississippi average: | 2.31 |
Full-time law enforcement employees in 2011, including police officers: 728 (439 officers - 349 male; 90 female).
| Officers per 1,000 residents here: | 2.52 |
| Mississippi average: | 2.00 |
Full-time law enforcement employees in 2010, including police officers: 706 (449 officers - 349 male; 100 female).
| Officers per 1,000 residents here: | 2.59 |
| Mississippi average: | 2.20 |
Full-time law enforcement employees in 2009, including police officers: 749 (485 officers - 373 male; 112 female).
| Officers per 1,000 residents here: | 2.81 |
| Mississippi average: | 2.02 |
Full-time law enforcement employees in 2008, including police officers: 657 (441 officers - 364 male; 77 female).
| Officers per 1,000 residents here: | 2.52 |
| Mississippi average: | 2.04 |
Full-time law enforcement employees in 2007, including police officers: 617 (429 officers - 319 male; 110 female).
| Officers per 1,000 residents here: | 2.44 |
| Mississippi average: | 2.20 |
Full-time law enforcement employees in 2006, including police officers: 647 (452 officers - 373 male; 79 female).
| Officers per 1,000 residents here: | 2.55 |
| Mississippi average: | 2.24 |
Full-time law enforcement employees in 2005, including police officers: 685 (483 officers - 400 male; 83 female).
| Officers per 1,000 residents here: | 2.68 |
| Mississippi average: | 2.10 |
Full-time law enforcement employees in 2004, including police officers: 794 (505 officers - 422 male; 83 female).
| Officers per 1,000 residents here: | 2.79 |
| Mississippi average: | 2.15 |
Full-time law enforcement employees in 2003, including police officers: 693 (455 officers - 377 male; 78 female).
| Officers per 1,000 residents here: | 2.51 |
| Mississippi average: | 2.18 |


Zip codes: 39157, 39174, 39201, 39202, 39203, 39204, 39206, 39211, 39216, 39217, 39269.