Crime rate in Lincoln, Nebraska (NE): murders, rapes, robberies, assaults, burglaries, thefts, auto thefts, arson, law enforcement employees, police officers, crime map
Crime rate in Lincoln, NE
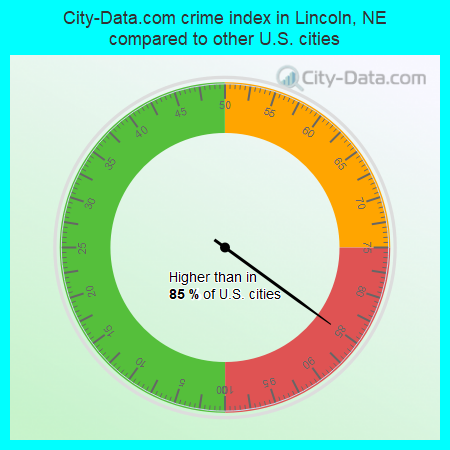
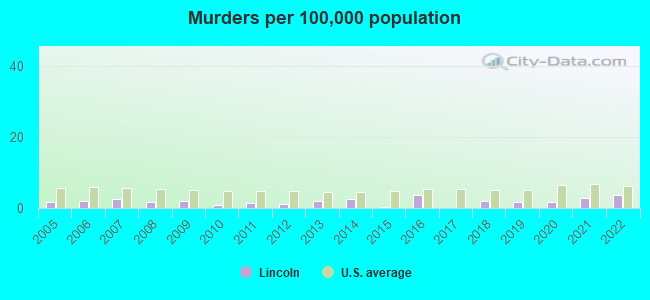
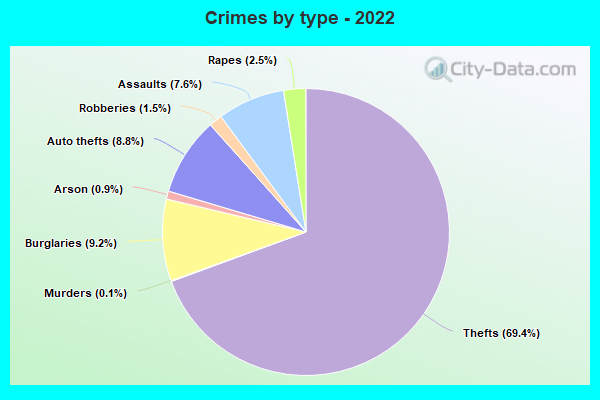
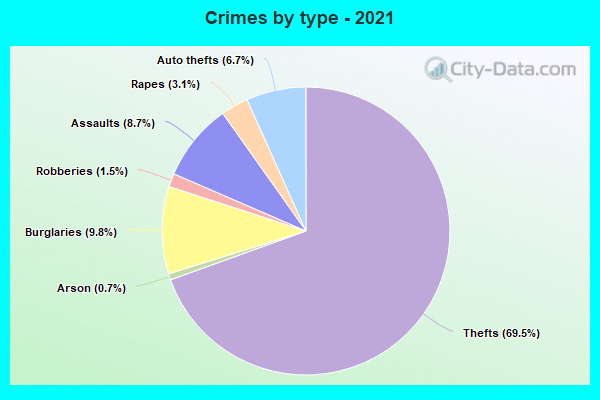
The 2022 crime rate in Lincoln, NE is 271 (City-Data.com crime index), which is comparable to the U.S. average. It was higher than in 85.0% U.S. cities. The 2022 Lincoln crime rate fell by 3% compared to 2021. The number of homicides stood at 11 - an increase of 3 compared to 2021. In the last 5 years Lincoln has seen increasing violent crime and decreasing property crime.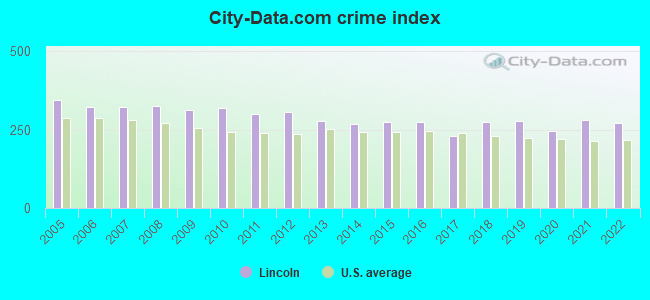
The City-Data.com crime index weighs serious crimes and violent crimes more heavily. Higher means more crime, U.S. average is 246.1. It adjusts for the number of visitors and daily workers commuting into cities.
- means the value is smaller than the state average.- means the value is about the same as the state average.
- means the value is bigger than the state average.
- means the value is much bigger than the state average.
According to our research of Nebraska and other state lists, there were 887 registered sex offenders living in Lincoln, Nebraska as of April 25, 2024.
The ratio of all residents to sex offenders in Lincoln is 316 to 1.
Violent crime rate in 2022
| Lincoln: | 237.3 |
| U.S. Average: | 219.8 |
Violent crime rate in 2021
| Lincoln: | 264.8 |
| U.S. Average: | 224.8 |
Violent crime rate in 2020
| Lincoln: | 230.0 |
| U.S. Average: | 228.2 |
Violent crime rate in 2019
| Lincoln: | 249.5 |
| U.S. Average: | 219.9 |
Violent crime rate in 2018
| Lincoln: | 233.2 |
| U.S. Average: | 221.2 |
Violent crime rate in 2017
| Lincoln: | 190.5 |
| U.S. Average: | 226.2 |
Violent crime rate in 2016
| Lincoln: | 223.7 |
| U.S. Average: | 227.3 |
Violent crime rate in 2015
| Lincoln: | 220.7 |
| U.S. Average: | 219.3 |
Violent crime rate in 2014
| Lincoln: | 201.1 |
| U.S. Average: | 211.1 |
Violent crime rate in 2013
| Lincoln: | 214.3 |
| U.S. Average: | 214.2 |
Violent crime rate in 2012
| Lincoln: | 234.9 |
| U.S. Average: | 187.4 |
Violent crime rate in 2011
| Lincoln: | 219.4 |
| U.S. Average: | 187.1 |
Violent crime rate in 2010
| Lincoln: | 272.3 |
| U.S. Average: | 195.7 |
Violent crime rate in 2009
| Lincoln: | 256.8 |
| U.S. Average: | 208.9 |
Violent crime rate in 2008
| Lincoln: | 279.7 |
| U.S. Average: | 222.5 |
Violent crime rate in 2007
| Lincoln: | 258.7 |
| U.S. Average: | 229.1 |
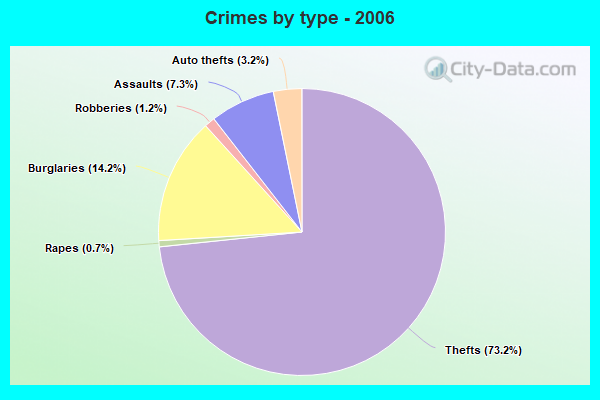
Violent crime rate in 2006
| Lincoln: | 246.4 |
| U.S. Average: | 232.6 |
Violent crime rate in 2005
| Lincoln: | 270.5 |
| U.S. Average: | 227.0 |
Property crime rate in 2022
| Lincoln: | 215.6 |
| U.S. Average: | 166.5 |
Property crime rate in 2021
| Lincoln: | 205.2 |
| U.S. Average: | 157.8 |
Property crime rate in 2020
| Lincoln: | 183.7 |
| U.S. Average: | 169.6 |
Property crime rate in 2019
| Lincoln: | 204.0 |
| U.S. Average: | 179.7 |
Property crime rate in 2018
| Lincoln: | 220.3 |
| U.S. Average: | 190.2 |
Property crime rate in 2017
| Lincoln: | 192.0 |
| U.S. Average: | 206.4 |
Property crime rate in 2016
| Lincoln: | 235.1 |
| U.S. Average: | 216.6 |
Property crime rate in 2015
| Lincoln: | 248.4 |
| U.S. Average: | 221.5 |
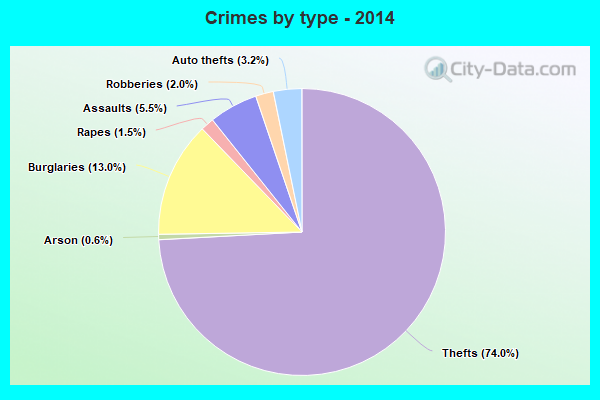
Property crime rate in 2014
| Lincoln: | 251.6 |
| U.S. Average: | 230.8 |
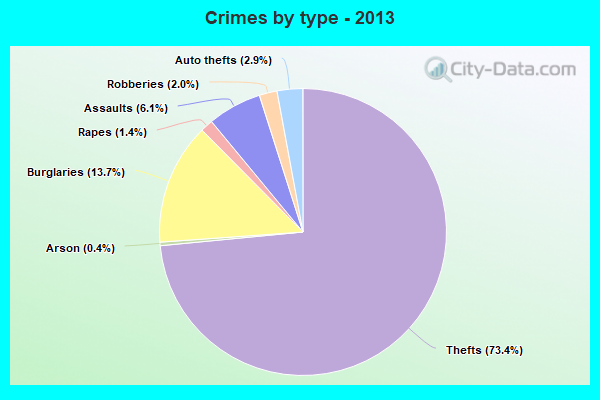
Property crime rate in 2013
| Lincoln: | 266.0 |
| U.S. Average: | 250.4 |
Property crime rate in 2012
| Lincoln: | 296.0 |
| U.S. Average: | 267.3 |
Property crime rate in 2011
| Lincoln: | 290.0 |
| U.S. Average: | 273.5 |
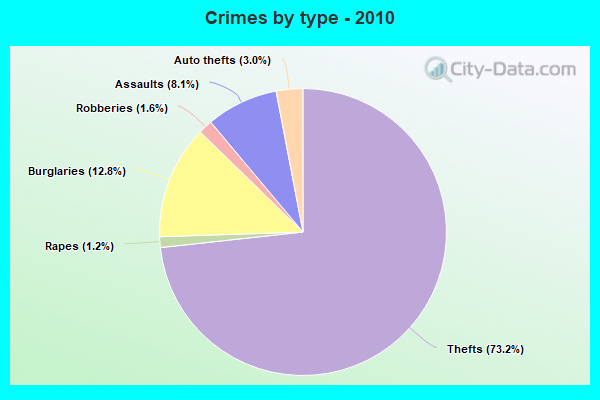
Property crime rate in 2010
| Lincoln: | 296.2 |
| U.S. Average: | 276.4 |
Property crime rate in 2009
| Lincoln: | 303.6 |
| U.S. Average: | 285.6 |
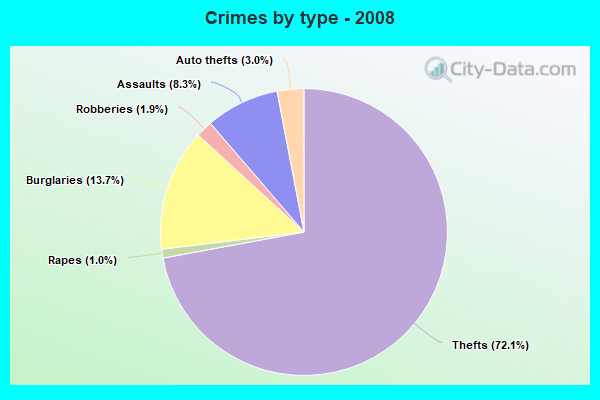
Property crime rate in 2008
| Lincoln: | 309.5 |
| U.S. Average: | 302.2 |
Property crime rate in 2007
| Lincoln: | 325.4 |
| U.S. Average: | 309.2 |
Property crime rate in 2006
| Lincoln: | 339.0 |
| U.S. Average: | 317.3 |
Property crime rate in 2005
| Lincoln: | 349.6 |
| U.S. Average: | 322.3 |
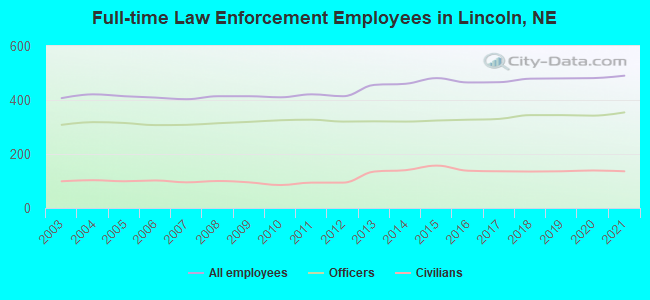
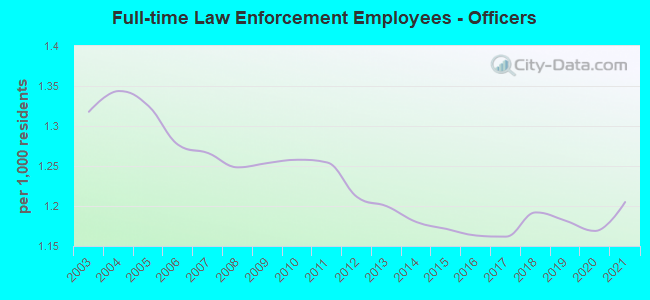
Full-time law enforcement employees in 2021, including police officers: 490 (354 officers - 296 male; 58 female).
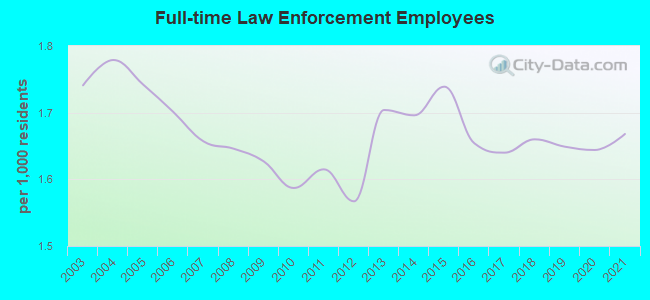
| Officers per 1,000 residents here: | 1.20 |
| US average: | 2.38 |
Full-time law enforcement employees in 2020, including police officers: 481 (342 officers - 287 male; 55 female).
| Officers per 1,000 residents here: | 1.17 |
| US average: | 2.41 |
Full-time law enforcement employees in 2019, including police officers: 480 (344 officers - 285 male; 59 female).
| Officers per 1,000 residents here: | 1.18 |
| US average: | 2.43 |
Full-time law enforcement employees in 2018, including police officers: 479 (344 officers - 288 male; 56 female).
| Officers per 1,000 residents here: | 1.19 |
| US average: | 2.40 |
Full-time law enforcement employees in 2017, including police officers: 466 (330 officers - 279 male; 51 female).
| Officers per 1,000 residents here: | 1.16 |
| US average: | 2.39 |
Full-time law enforcement employees in 2016, including police officers: 465 (327 officers - 278 male; 49 female).
| Officers per 1,000 residents here: | 1.16 |
| US average: | 2.38 |
Full-time law enforcement employees in 2015, including police officers: 481 (324 officers - 273 male; 51 female).
| Officers per 1,000 residents here: | 1.17 |
| US average: | 2.26 |
Full-time law enforcement employees in 2014, including police officers: 460 (320 officers - 266 male; 54 female).
| Officers per 1,000 residents here: | 1.18 |
| US average: | 2.30 |
Full-time law enforcement employees in 2013, including police officers: 456 (321 officers - 270 male; 51 female).
| Officers per 1,000 residents here: | 1.20 |
| US average: | 2.33 |
Full-time law enforcement employees in 2012, including police officers: 414 (320 officers - 273 male; 47 female).
| Officers per 1,000 residents here: | 1.21 |
| US average: | 2.36 |
Full-time law enforcement employees in 2011, including police officers: 421 (327 officers - 280 male; 47 female).
| Officers per 1,000 residents here: | 1.25 |
| US average: | 2.37 |
Full-time law enforcement employees in 2010, including police officers: 410 (325 officers - 278 male; 47 female).
| Officers per 1,000 residents here: | 1.26 |
| US average: | 2.42 |
Full-time law enforcement employees in 2009, including police officers: 414 (319 officers - 270 male; 49 female).
| Officers per 1,000 residents here: | 1.25 |
| US average: | 2.44 |
Full-time law enforcement employees in 2008, including police officers: 414 (314 officers - 265 male; 49 female).
| Officers per 1,000 residents here: | 1.25 |
| US average: | 2.47 |
Full-time law enforcement employees in 2007, including police officers: 403 (308 officers - 262 male; 46 female).
| Officers per 1,000 residents here: | 1.27 |
| US average: | 2.45 |
Full-time law enforcement employees in 2006, including police officers: 409 (307 officers - 257 male; 50 female).
| Officers per 1,000 residents here: | 1.28 |
| US average: | 2.42 |
Full-time law enforcement employees in 2005, including police officers: 414 (315 officers - 266 male; 49 female).
| Officers per 1,000 residents here: | 1.33 |
| US average: | 2.41 |
Full-time law enforcement employees in 2004, including police officers: 421 (318 officers - 266 male; 52 female).
| Officers per 1,000 residents here: | 1.34 |
| US average: | 2.43 |
Full-time law enforcement employees in 2003, including police officers: 407 (308 officers - 257 male; 51 female).
| Officers per 1,000 residents here: | 1.32 |
| US average: | 2.42 |


Zip codes: 68430, 68502, 68503, 68504, 68505, 68506, 68507, 68508, 68510, 68512, 68514, 68516, 68517, 68520, 68521, 68522, 68523, 68524, 68526, 68528, 68531.