Crime rate in Reading, Pennsylvania (PA): murders, rapes, robberies, assaults, burglaries, thefts, auto thefts, arson, law enforcement employees, police officers, crime map
Crime rate in Reading, PA
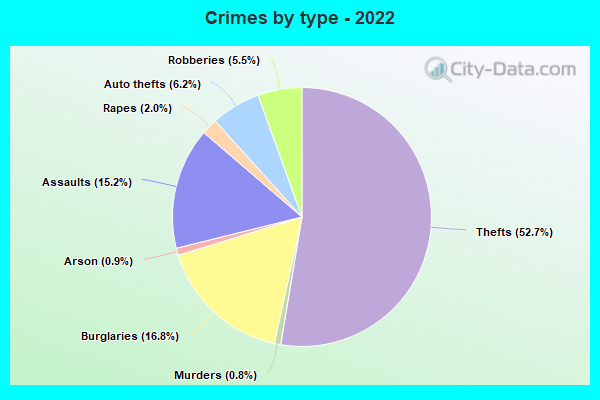
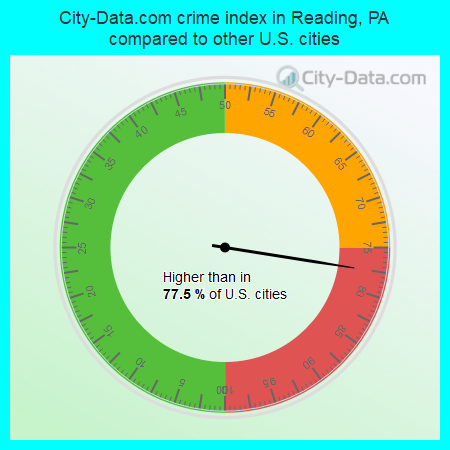
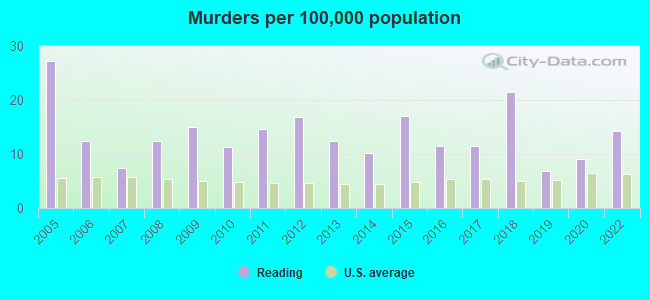
The 2022 crime rate in Reading, PA is 215 (City-Data.com crime index), which is about the average for the U.S. cities. It was higher than in 77.5% U.S. cities. The 2022 Reading crime rate fell by 11% compared to 2020. The number of homicides stood at 14 - an increase of 6 compared to 2020. In the last 5 years Reading has seen decline of violent crime and decreasing property crime.See how dangerous Reading, PA is compared to the nearest cities:
(Note: Higher means more crime)
(Note: Higher means more crime)
| Reading: | 214.6 |
| West Reading: | 37.2 |
| Wyomissing: | 82.2 |
| Shillington: | 33.8 |
| Laureldale: | 93.6 |
| Mohnton: | 19.2 |
| Sinking Spring: | 31.3 |
| Birdsboro: | 15.9 |
| Fleetwood: | 2.0 |
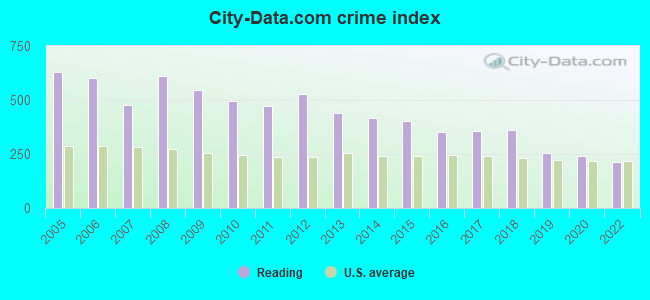
The City-Data.com crime index weighs serious crimes and violent crimes more heavily. Higher means more crime, U.S. average is 246.1. It adjusts for the number of visitors and daily workers commuting into cities.
- means the value is smaller than the state average.- means the value is about the same as the state average.
- means the value is bigger than the state average.
- means the value is much bigger than the state average.
According to our research of Pennsylvania and other state lists, there were 377 registered sex offenders living in Reading, Pennsylvania as of April 25, 2024.
The ratio of all residents to sex offenders in Reading is 232 to 1.
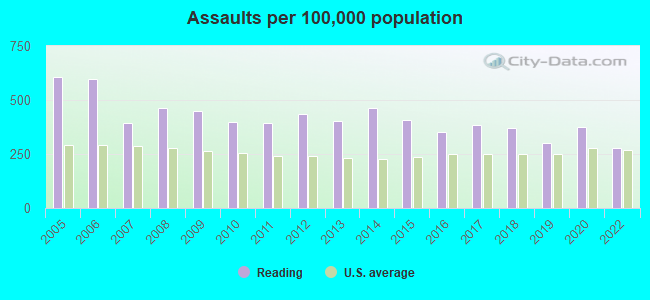
Violent crime rate in 2022
| Reading: | 256.9 |
| U.S. Average: | 219.8 |
Violent crime rate in 2020
| Reading: | 309.9 |
| U.S. Average: | 228.2 |
Violent crime rate in 2019
| Reading: | 292.5 |
| U.S. Average: | 219.9 |
Violent crime rate in 2018
| Reading: | 413.2 |
| U.S. Average: | 221.2 |
Violent crime rate in 2017
| Reading: | 408.6 |
| U.S. Average: | 226.2 |
Violent crime rate in 2016
| Reading: | 383.7 |
| U.S. Average: | 227.3 |
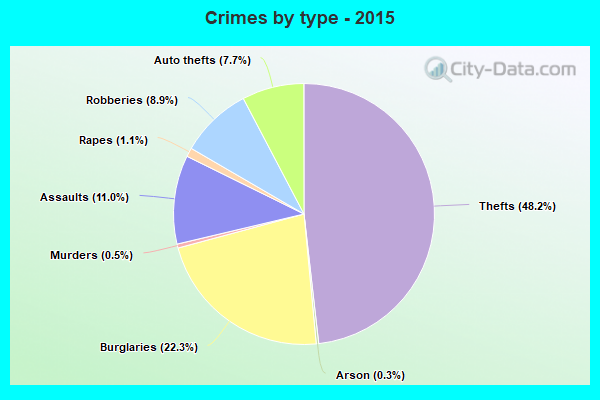
Violent crime rate in 2015
| Reading: | 446.8 |
| U.S. Average: | 219.3 |
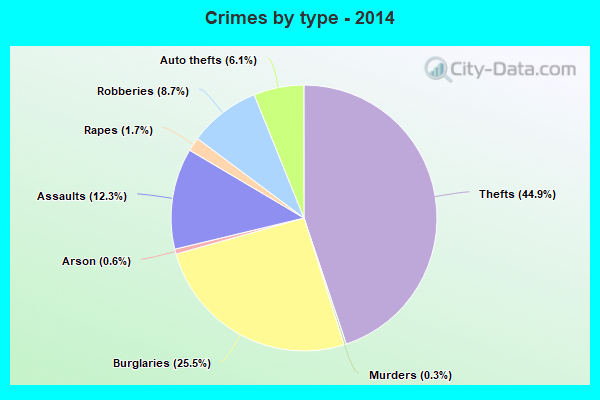
Violent crime rate in 2014
| Reading: | 479.2 |
| U.S. Average: | 211.1 |
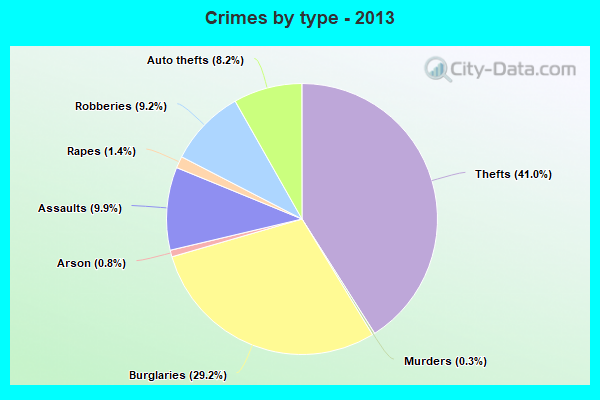
Violent crime rate in 2013
| Reading: | 469.9 |
| U.S. Average: | 214.2 |
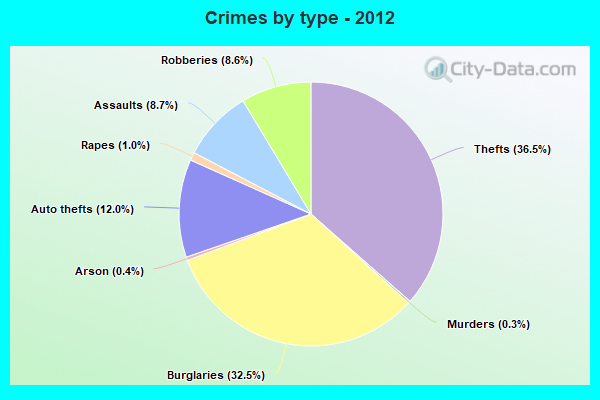
Violent crime rate in 2012
| Reading: | 517.7 |
| U.S. Average: | 187.4 |
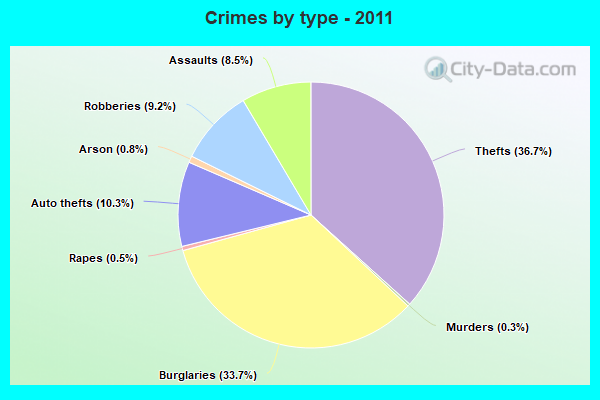
Violent crime rate in 2011
| Reading: | 463.4 |
| U.S. Average: | 187.1 |
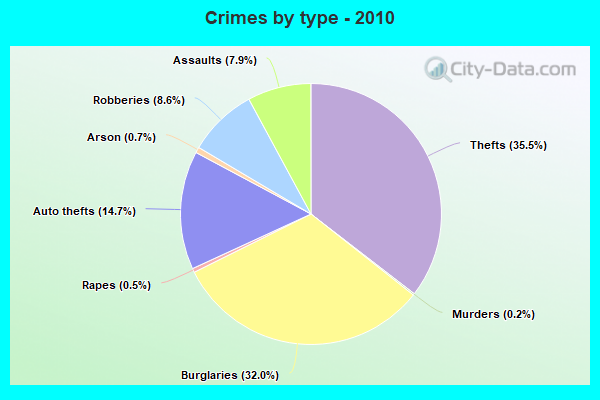
Violent crime rate in 2010
| Reading: | 463.8 |
| U.S. Average: | 195.7 |
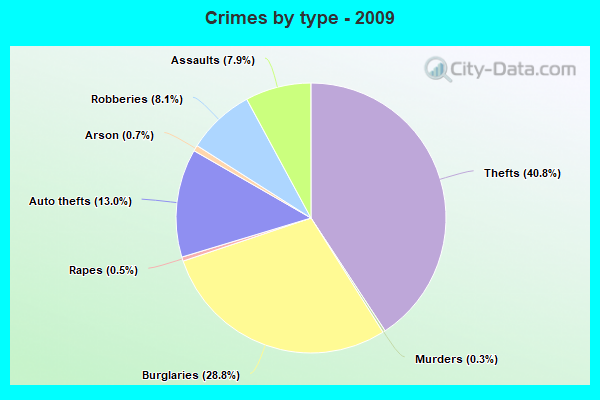
Violent crime rate in 2009
| Reading: | 511.7 |
| U.S. Average: | 208.9 |
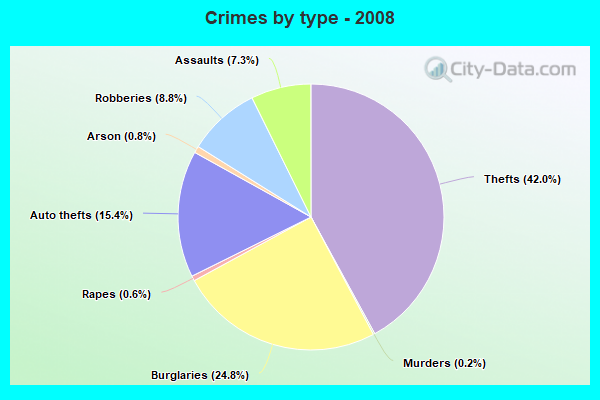
Violent crime rate in 2008
| Reading: | 575.7 |
| U.S. Average: | 222.5 |
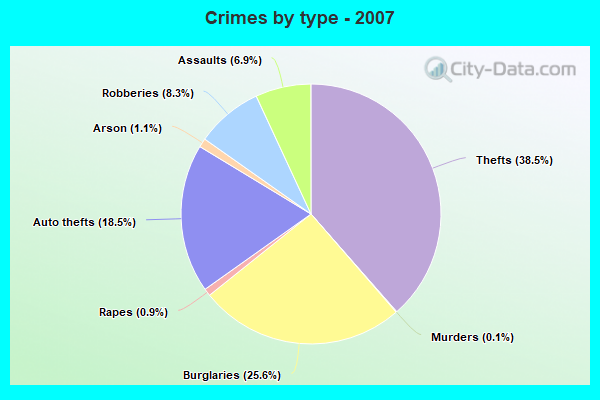
Violent crime rate in 2007
| Reading: | 433.5 |
| U.S. Average: | 229.1 |
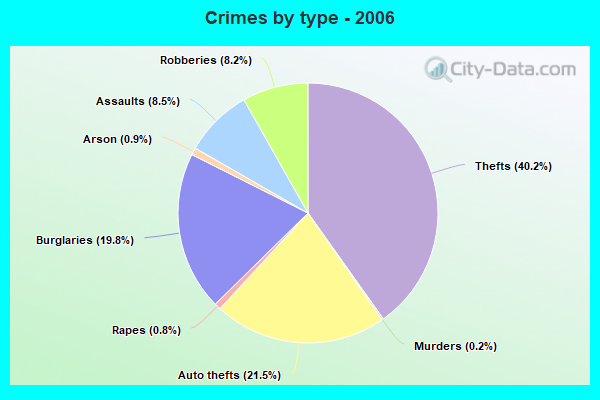
Violent crime rate in 2006
| Reading: | 577.0 |
| U.S. Average: | 232.6 |
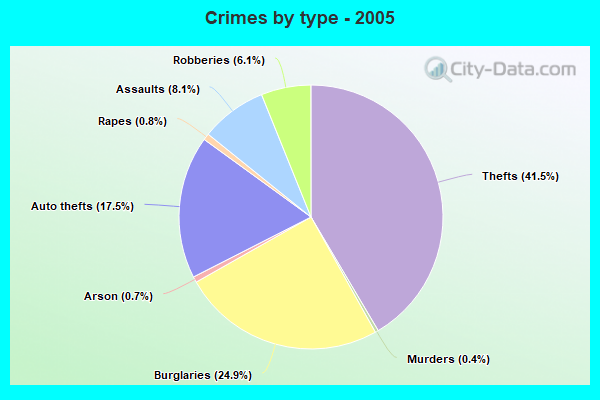
Violent crime rate in 2005
| Reading: | 565.5 |
| U.S. Average: | 227.0 |
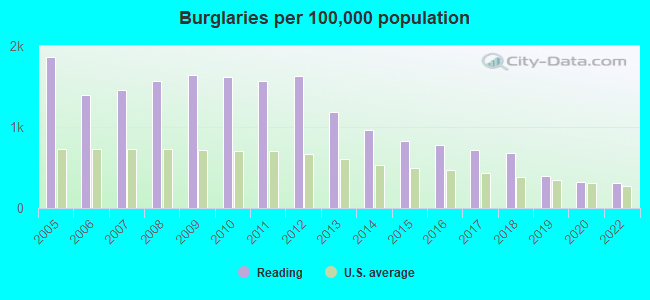
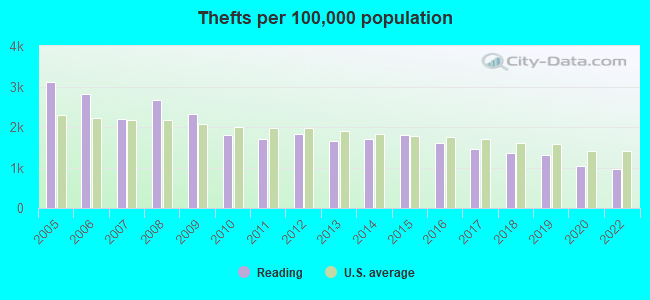
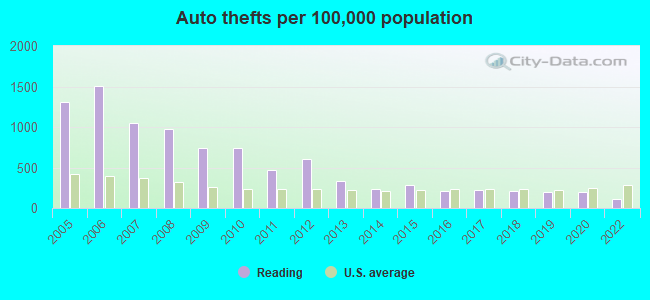
Property crime rate in 2022
| Reading: | 127.7 |
| U.S. Average: | 166.5 |
Property crime rate in 2020
| Reading: | 146.2 |
| U.S. Average: | 169.6 |
Property crime rate in 2019
| Reading: | 174.6 |
| U.S. Average: | 179.7 |
Property crime rate in 2018
| Reading: | 235.7 |
| U.S. Average: | 190.2 |
Property crime rate in 2017
| Reading: | 251.1 |
| U.S. Average: | 206.4 |
Property crime rate in 2016
| Reading: | 268.9 |
| U.S. Average: | 216.6 |
Property crime rate in 2015
| Reading: | 298.4 |
| U.S. Average: | 221.5 |
Property crime rate in 2014
| Reading: | 313.4 |
| U.S. Average: | 230.8 |
Property crime rate in 2013
| Reading: | 368.9 |
| U.S. Average: | 250.4 |
Property crime rate in 2012
| Reading: | 508.9 |
| U.S. Average: | 267.3 |
Property crime rate in 2011
| Reading: | 468.6 |
| U.S. Average: | 273.5 |
Property crime rate in 2010
| Reading: | 524.9 |
| U.S. Average: | 276.4 |
Property crime rate in 2009
| Reading: | 555.9 |
| U.S. Average: | 285.6 |
Property crime rate in 2008
| Reading: | 593.1 |
| U.S. Average: | 302.2 |
Property crime rate in 2007
| Reading: | 485.8 |
| U.S. Average: | 309.2 |
Property crime rate in 2006
| Reading: | 561.6 |
| U.S. Average: | 317.3 |
Property crime rate in 2005
| Reading: | 631.1 |
| U.S. Average: | 322.3 |
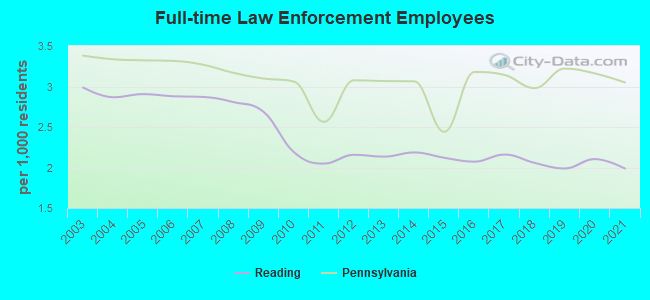
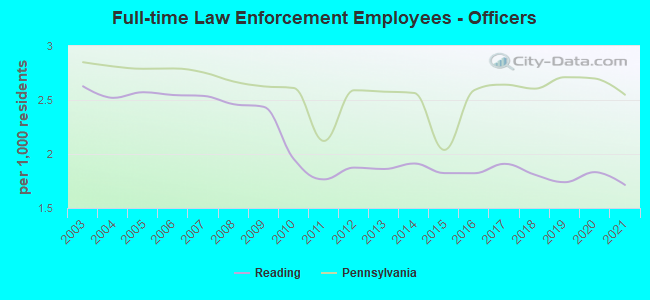
Full-time law enforcement employees in 2021, including police officers: 181 (156 officers - 142 male; 14 female).
| Officers per 1,000 residents here: | 1.71 |
| Pennsylvania average: | 2.55 |
Full-time law enforcement employees in 2020, including police officers: 186 (162 officers - 147 male; 15 female).
| Officers per 1,000 residents here: | 1.83 |
| Pennsylvania average: | 2.70 |
Full-time law enforcement employees in 2019, including police officers: 176 (154 officers - 146 male; 8 female).
| Officers per 1,000 residents here: | 1.74 |
| Pennsylvania average: | 2.71 |
Full-time law enforcement employees in 2018, including police officers: 182 (160 officers - 151 male; 9 female).
| Officers per 1,000 residents here: | 1.81 |
| Pennsylvania average: | 2.60 |
Full-time law enforcement employees in 2017, including police officers: 189 (167 officers - 157 male; 10 female).
| Officers per 1,000 residents here: | 1.91 |
| Pennsylvania average: | 2.64 |
Full-time law enforcement employees in 2016, including police officers: 182 (160 officers - 151 male; 9 female).
| Officers per 1,000 residents here: | 1.82 |
| Pennsylvania average: | 2.59 |
Full-time law enforcement employees in 2015, including police officers: 186 (160 officers - 150 male; 10 female).
| Officers per 1,000 residents here: | 1.82 |
| Pennsylvania average: | 2.04 |
Full-time law enforcement employees in 2014, including police officers: 192 (168 officers - 157 male; 11 female).
| Officers per 1,000 residents here: | 1.91 |
| Pennsylvania average: | 2.57 |
Full-time law enforcement employees in 2013, including police officers: 188 (164 officers - 155 male; 9 female).
| Officers per 1,000 residents here: | 1.86 |
| Pennsylvania average: | 2.58 |
Full-time law enforcement employees in 2012, including police officers: 191 (166 officers - 155 male; 11 female).
| Officers per 1,000 residents here: | 1.87 |
| Pennsylvania average: | 2.59 |
Full-time law enforcement employees in 2011, including police officers: 181 (156 officers - 144 male; 12 female).
| Officers per 1,000 residents here: | 1.77 |
| Pennsylvania average: | 2.12 |
Full-time law enforcement employees in 2010, including police officers: 193 (172 officers - 161 male; 11 female).
| Officers per 1,000 residents here: | 1.95 |
| Pennsylvania average: | 2.61 |
Full-time law enforcement employees in 2009, including police officers: 216 (196 officers - 183 male; 13 female).
| Officers per 1,000 residents here: | 2.44 |
| Pennsylvania average: | 2.63 |
Full-time law enforcement employees in 2008, including police officers: 227 (199 officers - 185 male; 14 female).
| Officers per 1,000 residents here: | 2.46 |
| Pennsylvania average: | 2.67 |
Full-time law enforcement employees in 2007, including police officers: 233 (206 officers - 194 male; 12 female).
| Officers per 1,000 residents here: | 2.54 |
| Pennsylvania average: | 2.76 |
Full-time law enforcement employees in 2006, including police officers: 233 (206 officers - 193 male; 13 female).
| Officers per 1,000 residents here: | 2.55 |
| Pennsylvania average: | 2.79 |
Full-time law enforcement employees in 2005, including police officers: 235 (208 officers - 195 male; 13 female).
| Officers per 1,000 residents here: | 2.57 |
| Pennsylvania average: | 2.79 |
Full-time law enforcement employees in 2004, including police officers: 231 (203 officers - 192 male; 11 female).
| Officers per 1,000 residents here: | 2.52 |
| Pennsylvania average: | 2.81 |
Full-time law enforcement employees in 2003, including police officers: 241 (212 officers - 200 male; 12 female).
| Officers per 1,000 residents here: | 2.63 |
| Pennsylvania average: | 2.85 |