Crime rate in Scottsdale, Arizona (AZ): murders, rapes, robberies, assaults, burglaries, thefts, auto thefts, arson, law enforcement employees, police officers, crime map
Crime rate in Scottsdale, AZ
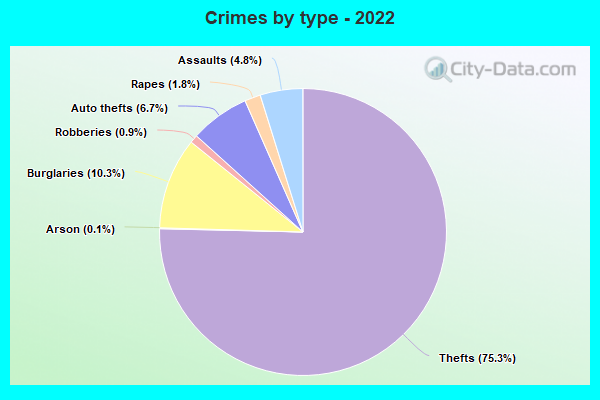
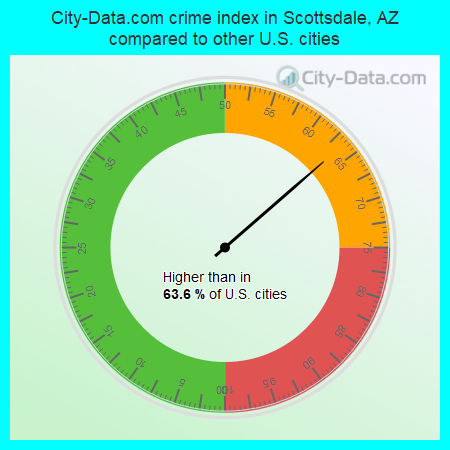
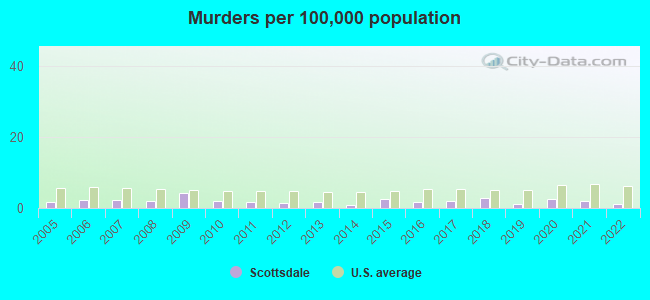
The 2022 crime rate in Scottsdale, AZ is 146 (City-Data.com crime index), which is 1.7 times lower than the U.S. average. It was higher than in 63.6% U.S. cities. The 2022 Scottsdale crime rate fell by 22% compared to 2021. The number of homicides stood at 3 - a decrease of 2 compared to 2021. In the last 5 years Scottsdale has seen decreasing violent crime and decreasing property crime.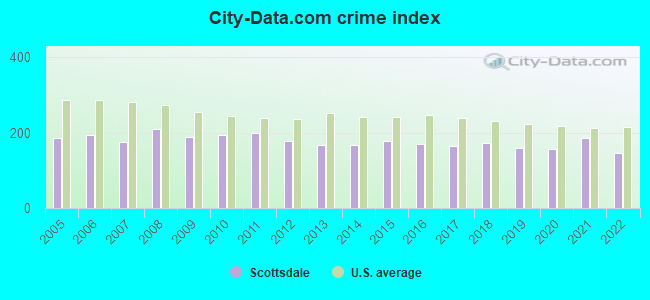
The City-Data.com crime index weighs serious crimes and violent crimes more heavily. Higher means more crime, U.S. average is 246.1. It adjusts for the number of visitors and daily workers commuting into cities.
- means the value is smaller than the state average.- means the value is about the same as the state average.
- means the value is bigger than the state average.
- means the value is much bigger than the state average.
According to our research of Arizona and other state lists, there were 59 registered sex offenders living in Scottsdale, Arizona as of April 26, 2024.
The ratio of all residents to sex offenders in Scottsdale is 4,180 to 1.
The ratio of registered sex offenders to all residents in this city is much lower than the state average.
Violent crime rate in 2022
| Scottsdale: | 99.1 |
| U.S. Average: | 219.8 |
Violent crime rate in 2021
| Scottsdale: | 133.8 |
| U.S. Average: | 224.8 |
Violent crime rate in 2020
| Scottsdale: | 114.1 |
| U.S. Average: | 228.2 |
Violent crime rate in 2019
| Scottsdale: | 107.5 |
| U.S. Average: | 219.9 |
Violent crime rate in 2018
| Scottsdale: | 110.8 |
| U.S. Average: | 221.2 |
Violent crime rate in 2017
| Scottsdale: | 102.0 |
| U.S. Average: | 226.2 |
Violent crime rate in 2016
| Scottsdale: | 97.8 |
| U.S. Average: | 227.3 |
Violent crime rate in 2015
| Scottsdale: | 119.3 |
| U.S. Average: | 219.3 |
Violent crime rate in 2014
| Scottsdale: | 99.0 |
| U.S. Average: | 211.1 |
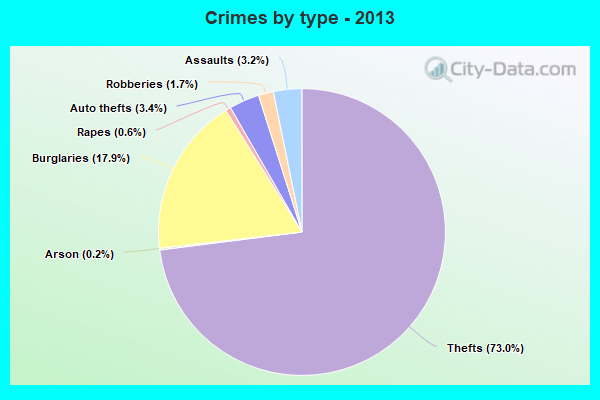
Violent crime rate in 2013
| Scottsdale: | 85.6 |
| U.S. Average: | 214.2 |
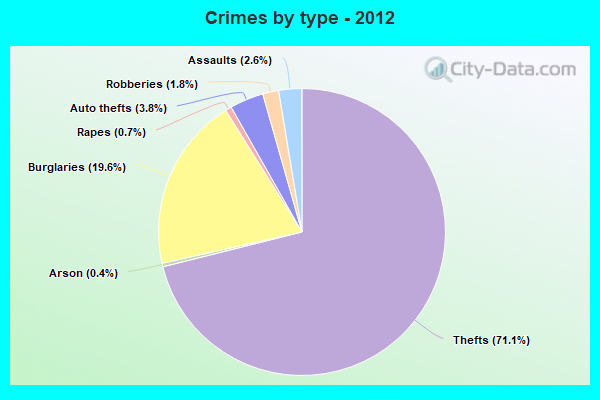
Violent crime rate in 2012
| Scottsdale: | 85.0 |
| U.S. Average: | 187.4 |
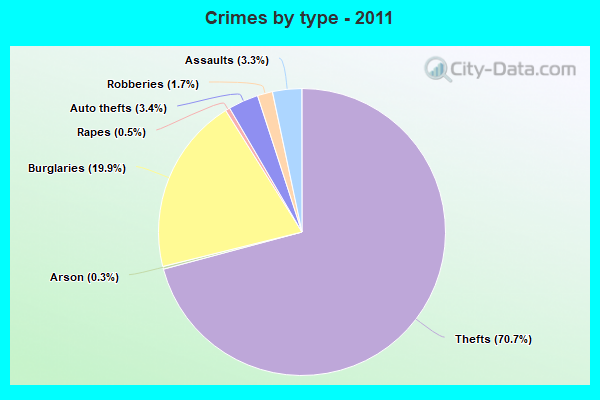
Violent crime rate in 2011
| Scottsdale: | 101.2 |
| U.S. Average: | 187.1 |
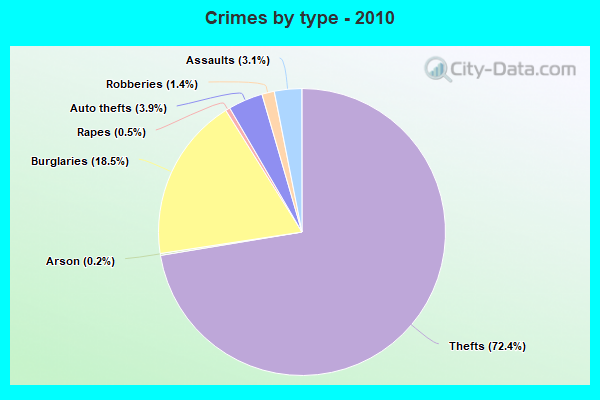
Violent crime rate in 2010
| Scottsdale: | 91.5 |
| U.S. Average: | 195.7 |
Violent crime rate in 2009
| Scottsdale: | 96.0 |
| U.S. Average: | 208.9 |
Violent crime rate in 2008
| Scottsdale: | 97.5 |
| U.S. Average: | 222.5 |
Violent crime rate in 2007
| Scottsdale: | 80.5 |
| U.S. Average: | 229.1 |
Violent crime rate in 2006
| Scottsdale: | 95.6 |
| U.S. Average: | 232.6 |
Violent crime rate in 2005
| Scottsdale: | 88.2 |
| U.S. Average: | 227.0 |
Property crime rate in 2022
| Scottsdale: | 141.8 |
| U.S. Average: | 166.5 |
Property crime rate in 2021
| Scottsdale: | 177.5 |
| U.S. Average: | 157.8 |
Property crime rate in 2020
| Scottsdale: | 144.3 |
| U.S. Average: | 169.6 |
Property crime rate in 2019
| Scottsdale: | 146.1 |
| U.S. Average: | 179.7 |
Property crime rate in 2018
| Scottsdale: | 163.9 |
| U.S. Average: | 190.2 |
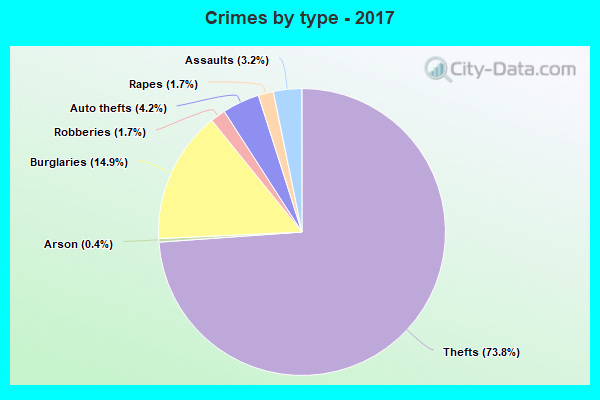
Property crime rate in 2017
| Scottsdale: | 170.7 |
| U.S. Average: | 206.4 |
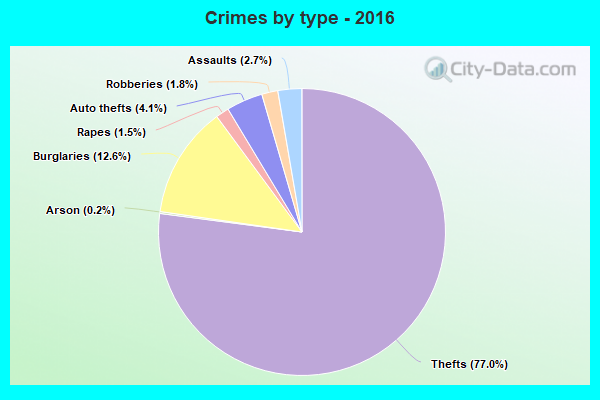
Property crime rate in 2016
| Scottsdale: | 176.4 |
| U.S. Average: | 216.6 |
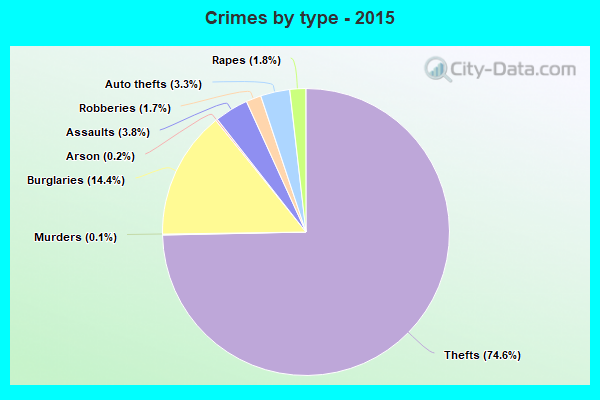
Property crime rate in 2015
| Scottsdale: | 175.4 |
| U.S. Average: | 221.5 |
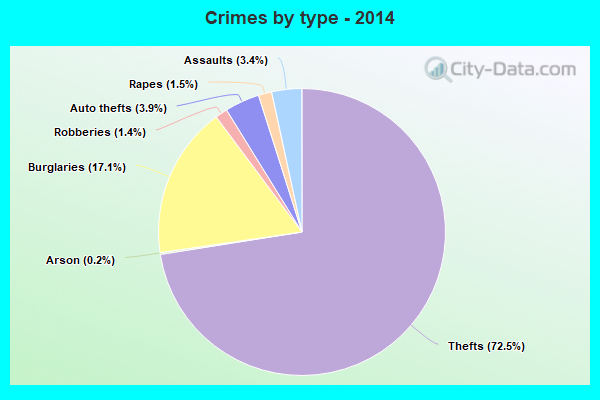
Property crime rate in 2014
| Scottsdale: | 188.6 |
| U.S. Average: | 230.8 |
Property crime rate in 2013
| Scottsdale: | 209.8 |
| U.S. Average: | 250.4 |
Property crime rate in 2012
| Scottsdale: | 230.4 |
| U.S. Average: | 267.3 |
Property crime rate in 2011
| Scottsdale: | 260.5 |
| U.S. Average: | 273.5 |
Property crime rate in 2010
| Scottsdale: | 251.7 |
| U.S. Average: | 276.4 |
Property crime rate in 2009
| Scottsdale: | 238.8 |
| U.S. Average: | 285.6 |
Property crime rate in 2008
| Scottsdale: | 280.5 |
| U.S. Average: | 302.2 |
Property crime rate in 2007
| Scottsdale: | 231.5 |
| U.S. Average: | 309.2 |
Property crime rate in 2006
| Scottsdale: | 256.7 |
| U.S. Average: | 317.3 |
Property crime rate in 2005
| Scottsdale: | 261.8 |
| U.S. Average: | 322.3 |

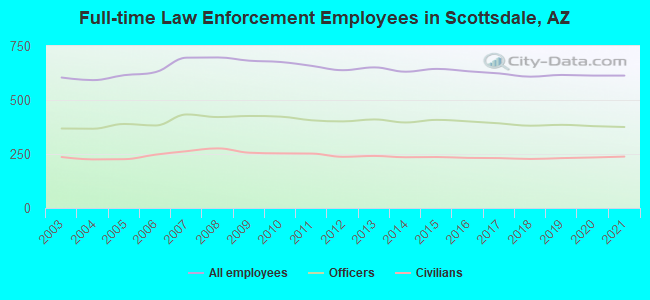
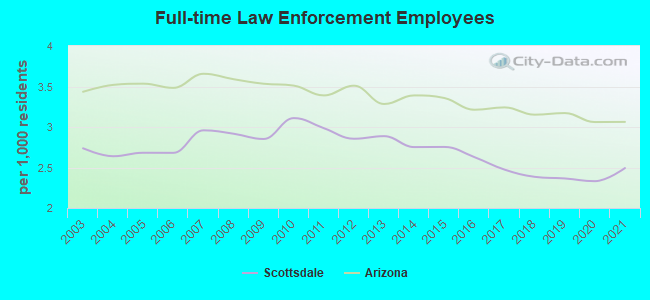
Full-time law enforcement employees in 2021, including police officers: 613 (375 officers - 338 male; 37 female).
| Officers per 1,000 residents here: | 1.53 |
| Arizona average: | 1.75 |
Full-time law enforcement employees in 2020, including police officers: 613 (379 officers - 338 male; 41 female).
| Officers per 1,000 residents here: | 1.44 |
| Arizona average: | 1.73 |
Full-time law enforcement employees in 2019, including police officers: 616 (385 officers - 342 male; 43 female).
| Officers per 1,000 residents here: | 1.48 |
| Arizona average: | 1.79 |
Full-time law enforcement employees in 2018, including police officers: 608 (381 officers - 340 male; 41 female).
| Officers per 1,000 residents here: | 1.49 |
| Arizona average: | 1.80 |
Full-time law enforcement employees in 2017, including police officers: 623 (392 officers - 348 male; 44 female).
| Officers per 1,000 residents here: | 1.56 |
| Arizona average: | 1.83 |
Full-time law enforcement employees in 2016, including police officers: 633 (401 officers - 354 male; 47 female).
| Officers per 1,000 residents here: | 1.66 |
| Arizona average: | 1.80 |
Full-time law enforcement employees in 2015, including police officers: 644 (408 officers - 363 male; 45 female).
| Officers per 1,000 residents here: | 1.74 |
| Arizona average: | 1.90 |
Full-time law enforcement employees in 2014, including police officers: 631 (396 officers - 352 male; 44 female).
| Officers per 1,000 residents here: | 1.73 |
| Arizona average: | 1.88 |
Full-time law enforcement employees in 2013, including police officers: 651 (410 officers - 364 male; 46 female).
| Officers per 1,000 residents here: | 1.82 |
| Arizona average: | 1.85 |
Full-time law enforcement employees in 2012, including police officers: 638 (401 officers - 364 male; 37 female).
| Officers per 1,000 residents here: | 1.79 |
| Arizona average: | 1.99 |
Full-time law enforcement employees in 2011, including police officers: 658 (406 officers - 360 male; 46 female).
| Officers per 1,000 residents here: | 1.84 |
| Arizona average: | 1.97 |
Full-time law enforcement employees in 2010, including police officers: 676 (423 officers - 374 male; 49 female).
| Officers per 1,000 residents here: | 1.95 |
| Arizona average: | 2.00 |
Full-time law enforcement employees in 2009, including police officers: 682 (426 officers - 379 male; 47 female).
| Officers per 1,000 residents here: | 1.78 |
| Arizona average: | 2.00 |
Full-time law enforcement employees in 2008, including police officers: 697 (421 officers - 375 male; 46 female).
| Officers per 1,000 residents here: | 1.76 |
| Arizona average: | 2.02 |
Full-time law enforcement employees in 2007, including police officers: 696 (433 officers - 386 male; 47 female).
| Officers per 1,000 residents here: | 1.84 |
| Arizona average: | 2.04 |
Full-time law enforcement employees in 2006, including police officers: 629 (382 officers - 342 male; 40 female).
| Officers per 1,000 residents here: | 1.63 |
| Arizona average: | 1.94 |
Full-time law enforcement employees in 2005, including police officers: 615 (389 officers - 350 male; 39 female).
| Officers per 1,000 residents here: | 1.70 |
| Arizona average: | 1.99 |
Full-time law enforcement employees in 2004, including police officers: 592 (367 officers - 331 male; 36 female).
| Officers per 1,000 residents here: | 1.64 |
| Arizona average: | 2.01 |
Full-time law enforcement employees in 2003, including police officers: 604 (368 officers - 327 male; 41 female).
| Officers per 1,000 residents here: | 1.67 |
| Arizona average: | 2.00 |