Crime rate in Shreveport, Louisiana (LA): murders, rapes, robberies, assaults, burglaries, thefts, auto thefts, arson, law enforcement employees, police officers, crime map
Crime rate in Shreveport, LA
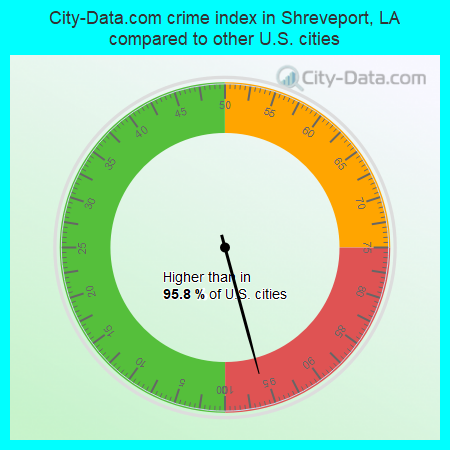
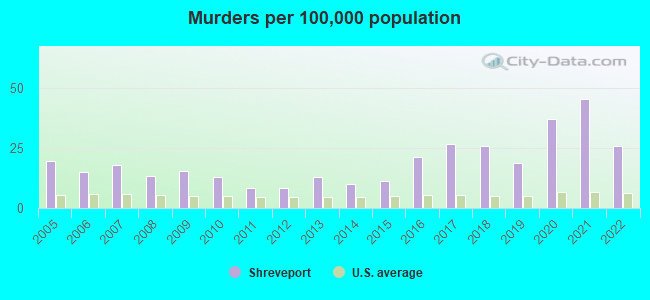
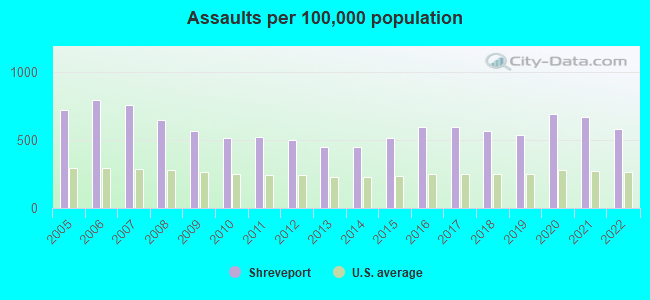
The 2022 crime rate in Shreveport, LA is 455 (City-Data.com crime index), which is 1.8 times higher than the U.S. average. It was higher than in 95.8% U.S. cities. The 2022 Shreveport crime rate fell by 13% compared to 2021. The number of homicides stood at 47 - a decrease of 36 compared to 2021. In the last 5 years Shreveport has seen decline of violent crime and decline of property crime.
The City-Data.com crime index weighs serious crimes and violent crimes more heavily. Higher means more crime, U.S. average is 246.1. It adjusts for the number of visitors and daily workers commuting into cities.
- means the value is smaller than the state average.- means the value is about the same as the state average.
- means the value is bigger than the state average.
- means the value is much bigger than the state average.
According to our research of Louisiana and other state lists, there were 661 registered sex offenders living in Shreveport, Louisiana as of April 25, 2024.
The ratio of all residents to sex offenders in Shreveport is 295 to 1.
Violent crime rate in 2022
| Shreveport: | 482.4 |
| U.S. Average: | 219.8 |
Violent crime rate in 2021
| Shreveport: | 567.7 |
| U.S. Average: | 224.8 |
Violent crime rate in 2020
| Shreveport: | 551.0 |
| U.S. Average: | 228.2 |
Violent crime rate in 2019
| Shreveport: | 453.2 |
| U.S. Average: | 219.9 |
Violent crime rate in 2018
| Shreveport: | 486.9 |
| U.S. Average: | 221.2 |
Violent crime rate in 2017
| Shreveport: | 556.4 |
| U.S. Average: | 226.2 |
Violent crime rate in 2016
| Shreveport: | 546.7 |
| U.S. Average: | 227.3 |
Violent crime rate in 2015
| Shreveport: | 458.8 |
| U.S. Average: | 219.3 |
Violent crime rate in 2014
| Shreveport: | 405.9 |
| U.S. Average: | 211.1 |
Violent crime rate in 2013
| Shreveport: | 385.5 |
| U.S. Average: | 214.2 |
Violent crime rate in 2012
| Shreveport: | 418.7 |
| U.S. Average: | 187.4 |
Violent crime rate in 2011
| Shreveport: | 426.6 |
| U.S. Average: | 187.1 |
Violent crime rate in 2010
| Shreveport: | 434.5 |
| U.S. Average: | 195.7 |
Violent crime rate in 2009
| Shreveport: | 499.2 |
| U.S. Average: | 208.9 |
Violent crime rate in 2008
| Shreveport: | 522.2 |
| U.S. Average: | 222.5 |
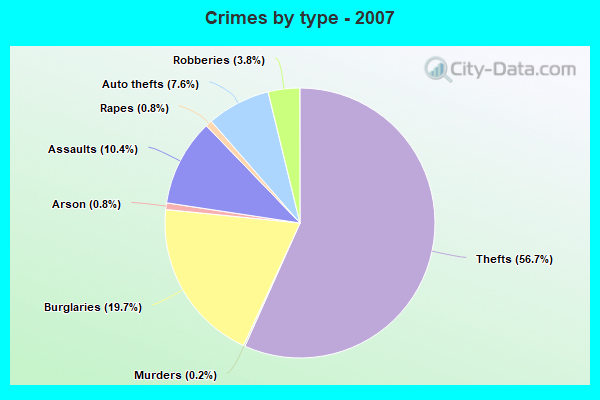
Violent crime rate in 2007
| Shreveport: | 479.3 |
| U.S. Average: | 229.1 |
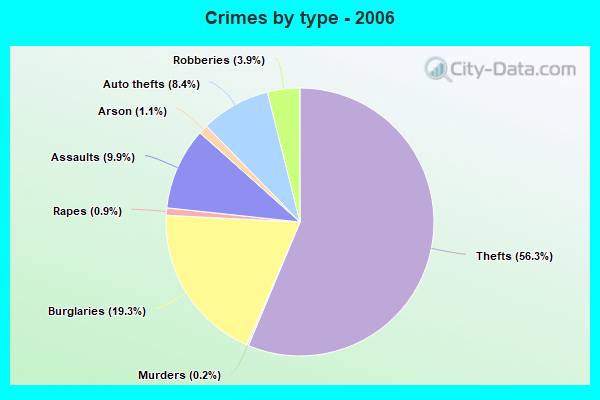
Violent crime rate in 2006
| Shreveport: | 519.6 |
| U.S. Average: | 232.6 |
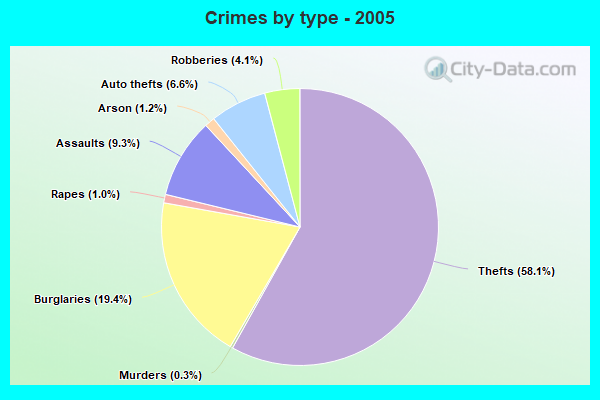
Violent crime rate in 2005
| Shreveport: | 500.9 |
| U.S. Average: | 227.0 |
Property crime rate in 2022
| Shreveport: | 332.9 |
| U.S. Average: | 166.5 |
Property crime rate in 2021
| Shreveport: | 347.8 |
| U.S. Average: | 157.8 |
Property crime rate in 2020
| Shreveport: | 400.3 |
| U.S. Average: | 169.6 |
Property crime rate in 2019
| Shreveport: | 409.6 |
| U.S. Average: | 179.7 |
Property crime rate in 2018
| Shreveport: | 445.5 |
| U.S. Average: | 190.2 |
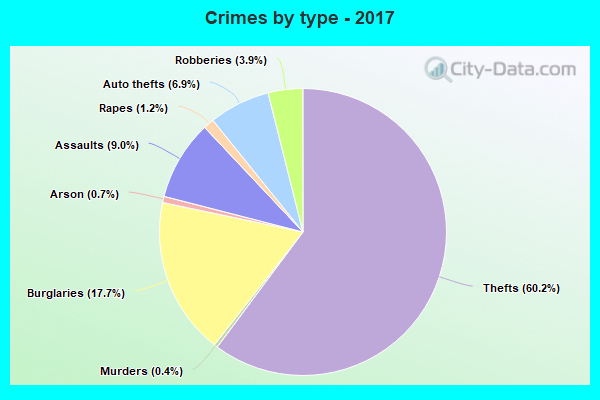
Property crime rate in 2017
| Shreveport: | 498.8 |
| U.S. Average: | 206.4 |
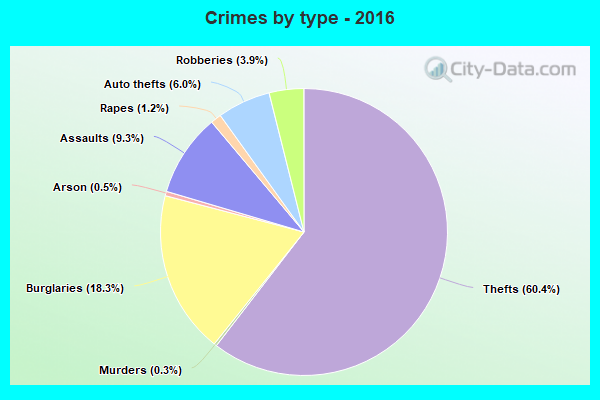
Property crime rate in 2016
| Shreveport: | 488.4 |
| U.S. Average: | 216.6 |
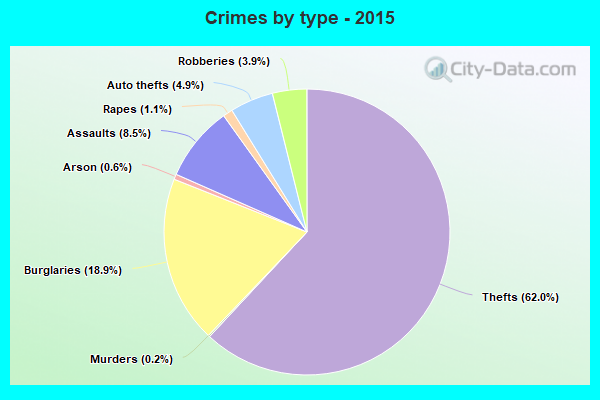
Property crime rate in 2015
| Shreveport: | 455.5 |
| U.S. Average: | 221.5 |
Property crime rate in 2014
| Shreveport: | 410.9 |
| U.S. Average: | 230.8 |
Property crime rate in 2013
| Shreveport: | 437.0 |
| U.S. Average: | 250.4 |
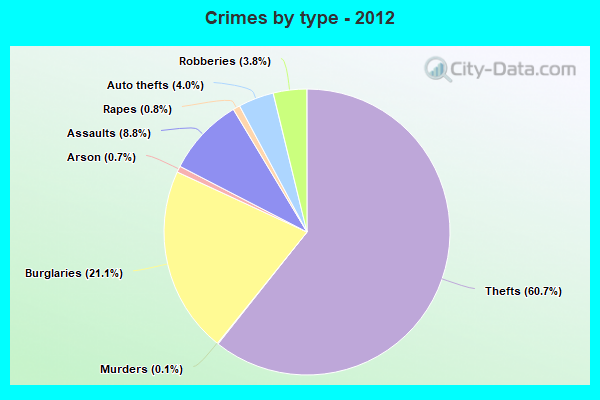
Property crime rate in 2012
| Shreveport: | 446.8 |
| U.S. Average: | 267.3 |
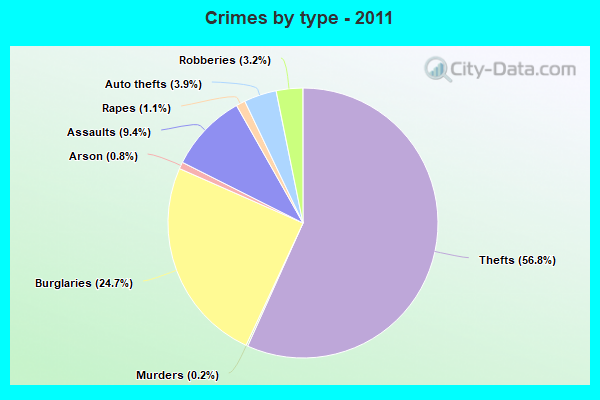
Property crime rate in 2011
| Shreveport: | 467.0 |
| U.S. Average: | 273.5 |
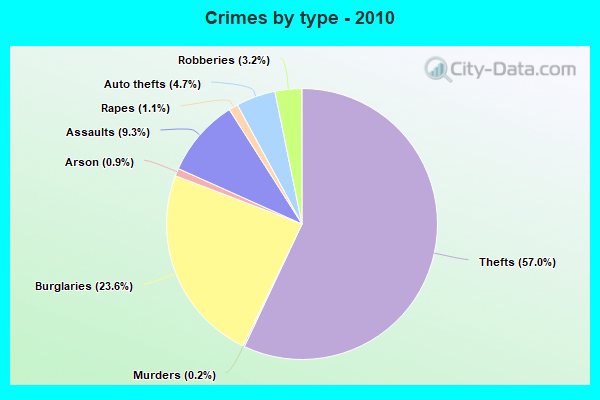
Property crime rate in 2010
| Shreveport: | 460.6 |
| U.S. Average: | 276.4 |
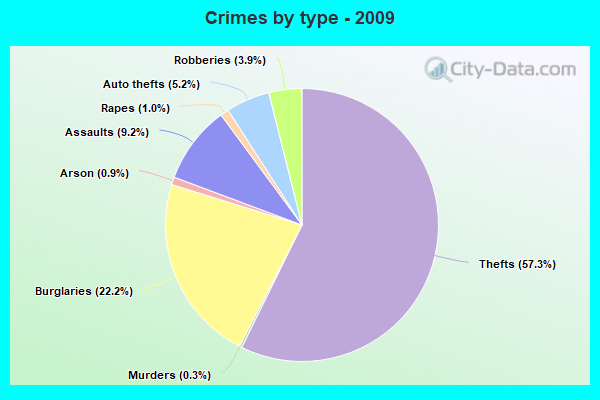
Property crime rate in 2009
| Shreveport: | 498.3 |
| U.S. Average: | 285.6 |
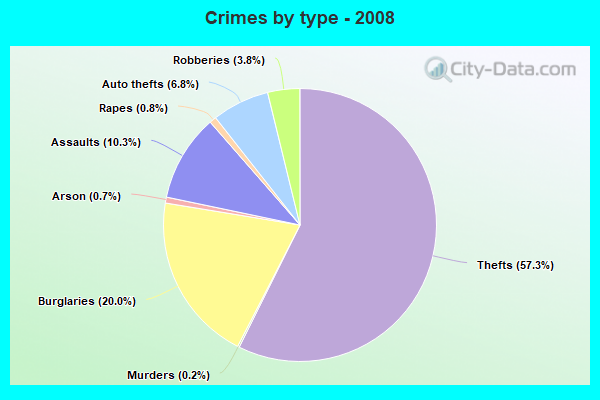
Property crime rate in 2008
| Shreveport: | 496.6 |
| U.S. Average: | 302.2 |
Property crime rate in 2007
| Shreveport: | 455.2 |
| U.S. Average: | 309.2 |
Property crime rate in 2006
| Shreveport: | 503.9 |
| U.S. Average: | 317.3 |
Property crime rate in 2005
| Shreveport: | 474.0 |
| U.S. Average: | 322.3 |

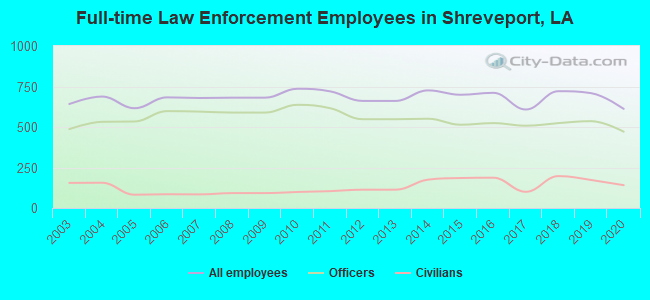
Full-time law enforcement employees in 2020, including police officers: 612 (471 officers - 358 male; 113 female).
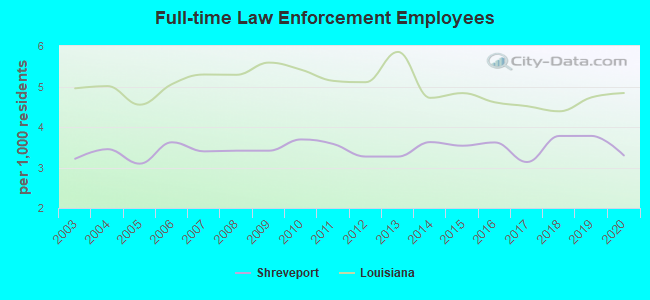
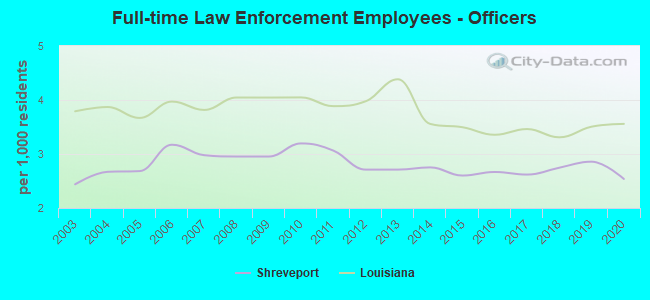
| Officers per 1,000 residents here: | 2.54 |
| Louisiana average: | 3.56 |
Full-time law enforcement employees in 2019, including police officers: 709 (536 officers - 415 male; 121 female).
| Officers per 1,000 residents here: | 2.86 |
| Louisiana average: | 3.51 |
Full-time law enforcement employees in 2018, including police officers: 721 (524 officers - 408 male; 116 female).
| Officers per 1,000 residents here: | 2.75 |
| Louisiana average: | 3.31 |
Full-time law enforcement employees in 2017, including police officers: 608 (508 officers - 396 male; 112 female).
| Officers per 1,000 residents here: | 2.62 |
| Louisiana average: | 3.46 |
Full-time law enforcement employees in 2016, including police officers: 711 (524 officers - 411 male; 113 female).
| Officers per 1,000 residents here: | 2.67 |
| Louisiana average: | 3.36 |
Full-time law enforcement employees in 2015, including police officers: 699 (514 officers - 411 male; 103 female).
| Officers per 1,000 residents here: | 2.60 |
| Louisiana average: | 3.50 |
Full-time law enforcement employees in 2014, including police officers: 726 (551 officers - 441 male; 110 female).
| Officers per 1,000 residents here: | 2.75 |
| Louisiana average: | 3.56 |
Full-time law enforcement employees in 2012, including police officers: 661 (548 officers - 442 male; 106 female).
| Officers per 1,000 residents here: | 2.71 |
| Louisiana average: | 3.98 |
Full-time law enforcement employees in 2011, including police officers: 720 (616 officers - 455 male; 161 female).
| Officers per 1,000 residents here: | 3.06 |
| Louisiana average: | 3.89 |
Full-time law enforcement employees in 2010, including police officers: 736 (637 officers - 478 male; 159 female).
| Officers per 1,000 residents here: | 3.20 |
| Louisiana average: | 4.05 |
Full-time law enforcement employees in 2008, including police officers: 681 (589 officers - 440 male; 149 female).
| Officers per 1,000 residents here: | 2.95 |
| Louisiana average: | 4.05 |
Full-time law enforcement employees in 2007, including police officers: 679 (595 officers - 451 male; 144 female).
| Officers per 1,000 residents here: | 2.98 |
| Louisiana average: | 3.82 |
Full-time law enforcement employees in 2006, including police officers: 683 (598 officers - 454 male; 144 female).
| Officers per 1,000 residents here: | 3.17 |
| Louisiana average: | 3.97 |
Full-time law enforcement employees in 2005, including police officers: 616 (534 officers - 448 male; 86 female).
| Officers per 1,000 residents here: | 2.68 |
| Louisiana average: | 3.67 |
Full-time law enforcement employees in 2004, including police officers: 688 (532 officers - 451 male; 81 female).
| Officers per 1,000 residents here: | 2.67 |
| Louisiana average: | 3.87 |
Full-time law enforcement employees in 2003, including police officers: 642 (487 officers - 409 male; 78 female).
| Officers per 1,000 residents here: | 2.44 |
| Louisiana average: | 3.79 |


Zip codes: 71047, 71101, 71103, 71104, 71105, 71106, 71108, 71109, 71115, 71118.