Crime rate in Springfield, Massachusetts (MA): murders, rapes, robberies, assaults, burglaries, thefts, auto thefts, arson, law enforcement employees, police officers, crime map

Crime rate in Springfield, MA
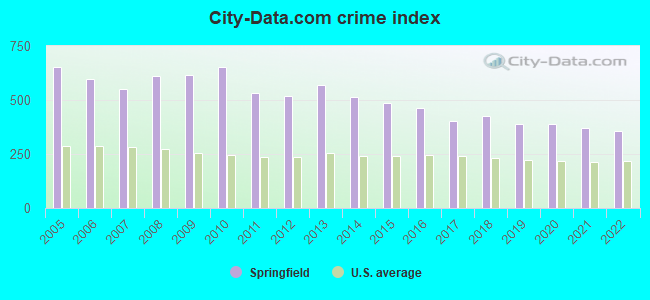
The 2022 crime rate in Springfield, MA is 357 (City-Data.com crime index), which is 1.4 times higher than the U.S. average. It was higher than in 91.9% U.S. cities. The 2022 Springfield crime rate fell by 4% compared to 2021. The number of homicides stood at 14 - a decrease of 4 compared to 2021. In the last 5 years Springfield has seen decline of violent crime and decreasing property crime.See how dangerous Springfield, MA is compared to the nearest cities:
(Note: Higher means more crime)
(Note: Higher means more crime)
| Springfield: | 356.6 |
| East Longmeadow: | 137.3 |
| Longmeadow: | 56.8 |
| Chicopee: | 256.5 |
| West Springfield: | 330.9 |
| Agawam: | 182.3 |
| Ludlow: | 96.0 |
| Wilbraham: | 119.4 |
| Holyoke: | 424.4 |
The City-Data.com crime index weighs serious crimes and violent crimes more heavily. Higher means more crime, U.S. average is 246.1. It adjusts for the number of visitors and daily workers commuting into cities.
- means the value is smaller than the state average.- means the value is about the same as the state average.
- means the value is bigger than the state average.
- means the value is much bigger than the state average.
According to our research of Massachusetts and other state lists, there were 315 registered sex offenders living in Springfield, Massachusetts as of April 25, 2024.
The ratio of all residents to sex offenders in Springfield is 489 to 1.

Violent crime rate in 2022
| Springfield: | 471.2 |
| U.S. Average: | 219.8 |
Violent crime rate in 2021
| Springfield: | 505.8 |
| U.S. Average: | 224.8 |
Violent crime rate in 2020
| Springfield: | 524.5 |
| U.S. Average: | 228.2 |
Violent crime rate in 2019
| Springfield: | 499.0 |
| U.S. Average: | 219.9 |
Violent crime rate in 2018
| Springfield: | 550.0 |
| U.S. Average: | 221.2 |
Violent crime rate in 2017
| Springfield: | 477.5 |
| U.S. Average: | 226.2 |
Violent crime rate in 2016
| Springfield: | 554.2 |
| U.S. Average: | 227.3 |
Violent crime rate in 2015
| Springfield: | 589.3 |
| U.S. Average: | 219.3 |
Violent crime rate in 2014
| Springfield: | 589.2 |
| U.S. Average: | 211.1 |
Violent crime rate in 2013
| Springfield: | 597.1 |
| U.S. Average: | 214.2 |
Violent crime rate in 2012
| Springfield: | 543.0 |
| U.S. Average: | 187.4 |
Violent crime rate in 2011
| Springfield: | 542.2 |
| U.S. Average: | 187.1 |
Violent crime rate in 2010
| Springfield: | 742.8 |
| U.S. Average: | 195.7 |
Violent crime rate in 2009
| Springfield: | 685.8 |
| U.S. Average: | 208.9 |
Violent crime rate in 2008
| Springfield: | 680.0 |
| U.S. Average: | 222.5 |
Violent crime rate in 2007
| Springfield: | 610.4 |
| U.S. Average: | 229.1 |
Violent crime rate in 2006
| Springfield: | 658.6 |
| U.S. Average: | 232.6 |
Violent crime rate in 2005
| Springfield: | 781.9 |
| U.S. Average: | 227.0 |
Property crime rate in 2022
| Springfield: | 207.1 |
| U.S. Average: | 166.5 |
Property crime rate in 2021
| Springfield: | 206.7 |
| U.S. Average: | 157.8 |
Property crime rate in 2020
| Springfield: | 215.1 |
| U.S. Average: | 169.6 |
Property crime rate in 2019
| Springfield: | 234.4 |
| U.S. Average: | 179.7 |
Property crime rate in 2018
| Springfield: | 247.5 |
| U.S. Average: | 190.2 |
Property crime rate in 2017
| Springfield: | 296.4 |
| U.S. Average: | 206.4 |
Property crime rate in 2016
| Springfield: | 347.3 |
| U.S. Average: | 216.6 |
Property crime rate in 2015
| Springfield: | 334.8 |
| U.S. Average: | 221.5 |
Property crime rate in 2014
| Springfield: | 408.1 |
| U.S. Average: | 230.8 |
Property crime rate in 2013
| Springfield: | 510.3 |
| U.S. Average: | 250.4 |
Property crime rate in 2012
| Springfield: | 501.6 |
| U.S. Average: | 267.3 |
Property crime rate in 2011
| Springfield: | 530.4 |
| U.S. Average: | 273.5 |
Property crime rate in 2010
| Springfield: | 564.5 |
| U.S. Average: | 276.4 |
Property crime rate in 2009
| Springfield: | 501.5 |
| U.S. Average: | 285.6 |
Property crime rate in 2008
| Springfield: | 501.5 |
| U.S. Average: | 302.2 |
Property crime rate in 2007
| Springfield: | 453.2 |
| U.S. Average: | 309.2 |
Property crime rate in 2006
| Springfield: | 503.2 |
| U.S. Average: | 317.3 |
Property crime rate in 2005
| Springfield: | 501.3 |
| U.S. Average: | 322.3 |


Full-time law enforcement employees in 2021, including police officers: 574 (465 officers - 405 male; 60 female).
| Officers per 1,000 residents here: | 3.02 |
| Massachusetts average: | 2.53 |
Full-time law enforcement employees in 2020, including police officers: 622 (474 officers - 419 male; 55 female).
| Officers per 1,000 residents here: | 3.10 |
| Massachusetts average: | 2.59 |
Full-time law enforcement employees in 2019, including police officers: 552 (489 officers - 444 male; 45 female).
| Officers per 1,000 residents here: | 3.17 |
| Massachusetts average: | 2.59 |
Full-time law enforcement employees in 2018, including police officers: 552 (489 officers - 444 male; 45 female).
| Officers per 1,000 residents here: | 3.15 |
| Massachusetts average: | 2.60 |
Full-time law enforcement employees in 2017, including police officers: 516 (448 officers - 405 male; 43 female).
| Officers per 1,000 residents here: | 2.90 |
| Massachusetts average: | 2.60 |
Full-time law enforcement employees in 2016, including police officers: 523 (419 officers - 381 male; 38 female).
| Officers per 1,000 residents here: | 2.72 |
| Massachusetts average: | 2.63 |
Full-time law enforcement employees in 2015, including police officers: 556 (456 officers - 415 male; 41 female).
| Officers per 1,000 residents here: | 2.96 |
| Massachusetts average: | 2.54 |
Full-time law enforcement employees in 2014, including police officers: 518 (435 officers - 397 male; 38 female).
| Officers per 1,000 residents here: | 2.83 |
| Massachusetts average: | 2.55 |
Full-time law enforcement employees in 2013, including police officers: 500 (442 officers - 403 male; 39 female).
| Officers per 1,000 residents here: | 2.88 |
| Massachusetts average: | 2.51 |
Full-time law enforcement employees in 2012, including police officers: 413 (368 officers - 336 male; 32 female).
| Officers per 1,000 residents here: | 2.38 |
| Massachusetts average: | 2.49 |
Full-time law enforcement employees in 2011, including police officers: 550 (456 officers - 422 male; 34 female).
| Officers per 1,000 residents here: | 2.96 |
| Massachusetts average: | 2.52 |
Full-time law enforcement employees in 2010, including police officers: 536 (436 officers - 403 male; 33 female).
| Officers per 1,000 residents here: | 2.85 |
| Massachusetts average: | 2.49 |
Full-time law enforcement employees in 2009, including police officers: 539 (450 officers - 404 male; 46 female).
| Officers per 1,000 residents here: | 2.93 |
| Massachusetts average: | 2.18 |
Full-time law enforcement employees in 2008, including police officers: 568 (467 officers - 432 male; 35 female).
| Officers per 1,000 residents here: | 3.09 |
| Massachusetts average: | 2.64 |
Full-time law enforcement employees in 2007, including police officers: 546 (450 officers - 418 male; 32 female).
| Officers per 1,000 residents here: | 2.98 |
| Massachusetts average: | 2.64 |
Full-time law enforcement employees in 2006, including police officers: 541 (445 officers - 413 male; 32 female).
| Officers per 1,000 residents here: | 2.92 |
| Massachusetts average: | 2.67 |
Full-time law enforcement employees in 2005, including police officers: 527 (447 officers - 417 male; 30 female).
| Officers per 1,000 residents here: | 2.95 |
| Massachusetts average: | 2.62 |
Full-time law enforcement employees in 2004, including police officers: 553 (472 officers - 439 male; 33 female).
| Officers per 1,000 residents here: | 3.11 |
| Massachusetts average: | 2.54 |
Full-time law enforcement employees in 2003, including police officers: 529 (464 officers - 433 male; 31 female).
| Officers per 1,000 residents here: | 3.05 |
| Massachusetts average: | 2.56 |


Zip codes: 01103, 01104, 01105, 01107, 01108, 01109, 01118, 01119, 01128, 01129, 01151, 01199.