Crime rate in White Plains, New York (NY): murders, rapes, robberies, assaults, burglaries, thefts, auto thefts, arson, law enforcement employees, police officers, crime map
Crime rate in White Plains, NY
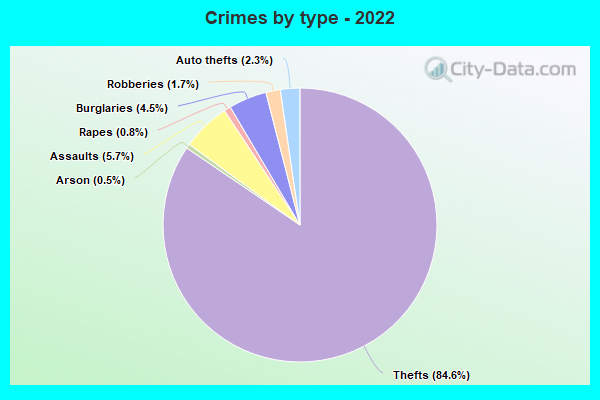
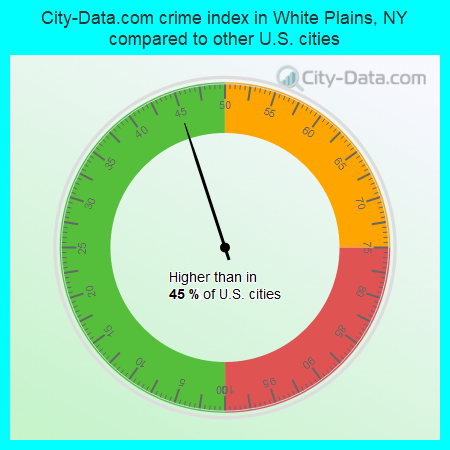
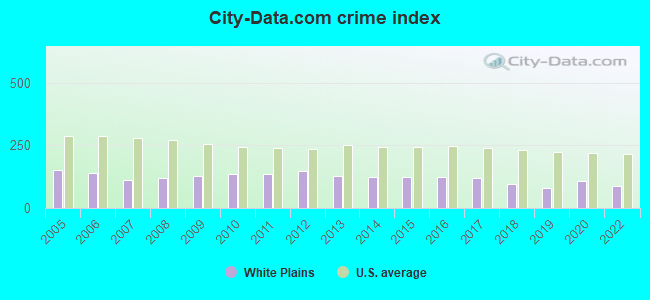
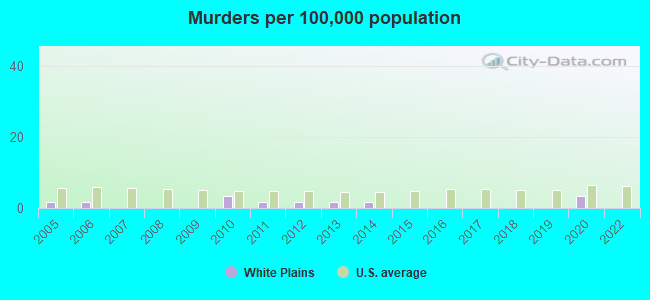
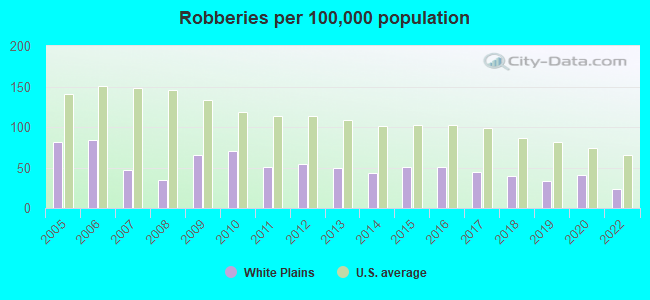
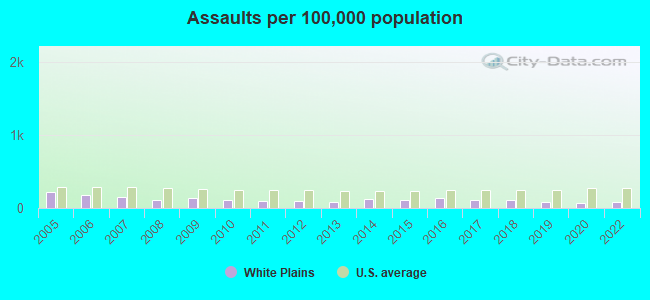
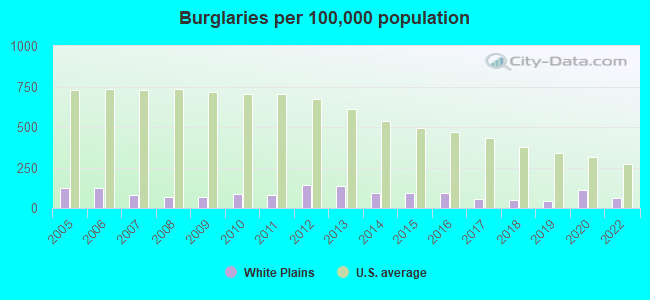
The 2022 crime rate in White Plains, NY is 86 (City-Data.com crime index), which is 2.9 times smaller than the U.S. average. It was higher than in 45.0% U.S. cities. The 2022 White Plains crime rate fell by 21% compared to 2020. In the last 5 years White Plains has seen decline of violent crime and decline of property crime.See how dangerous White Plains, NY is compared to the nearest cities:
(Note: Higher means more crime)
(Note: Higher means more crime)
| White Plains: | 86.3 |
| Scarsdale: | 8.6 |
| Harrison: | 40.0 |
| Elmsford: | 28.9 |
| Greenburgh: | 89.8 |
| Rye Brook: | 44.4 |
| Ardsley: | 35.4 |
| Port Chester: | 61.6 |
| Rye: | 8.7 |
The City-Data.com crime index weighs serious crimes and violent crimes more heavily. Higher means more crime, U.S. average is 246.1. It adjusts for the number of visitors and daily workers commuting into cities.
- means the value is smaller than the state average.- means the value is about the same as the state average.
- means the value is bigger than the state average.
According to our research of New York and other state lists, there were 31 registered sex offenders living in White Plains, New York as of April 26, 2024.
The ratio of all residents to sex offenders in White Plains is 1,879 to 1.
The ratio of registered sex offenders to all residents in this city is lower than the state average.
Violent crime rate in 2022
| White Plains: | 63.0 |
| U.S. Average: | 219.8 |
Violent crime rate in 2020
| White Plains: | 69.5 |
| U.S. Average: | 228.2 |
Violent crime rate in 2019
| White Plains: | 62.7 |
| U.S. Average: | 219.9 |
Violent crime rate in 2018
| White Plains: | 81.7 |
| U.S. Average: | 221.2 |
Violent crime rate in 2017
| White Plains: | 95.8 |
| U.S. Average: | 226.2 |
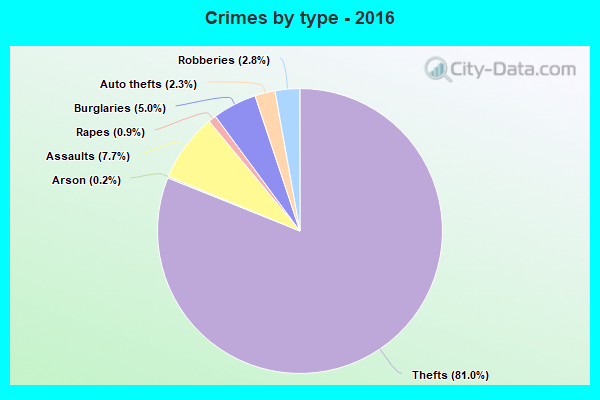
Violent crime rate in 2016
| White Plains: | 111.5 |
| U.S. Average: | 227.3 |
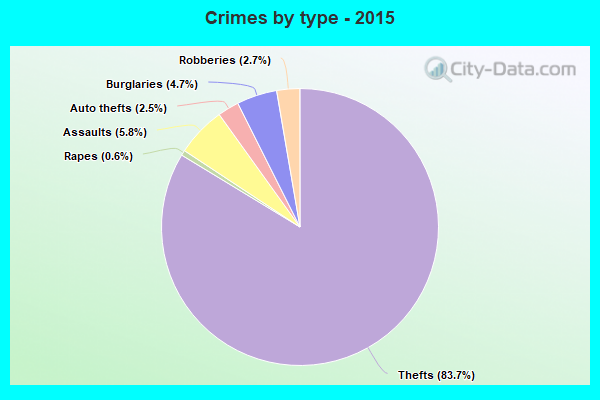
Violent crime rate in 2015
| White Plains: | 93.5 |
| U.S. Average: | 219.3 |
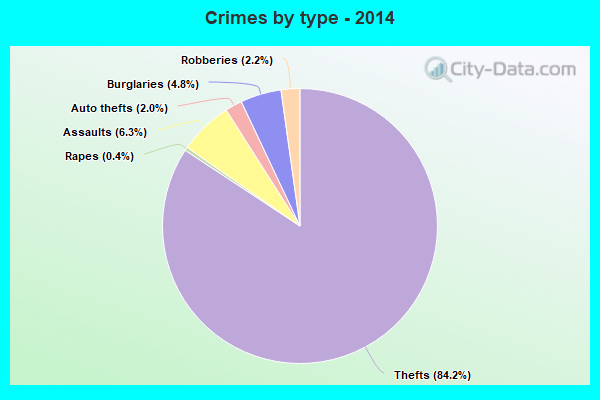
Violent crime rate in 2014
| White Plains: | 96.4 |
| U.S. Average: | 211.1 |
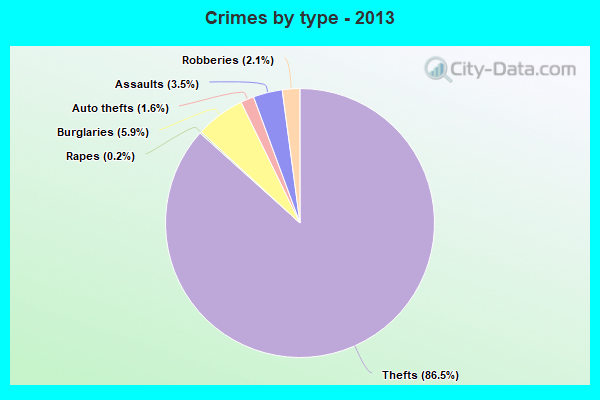
Violent crime rate in 2013
| White Plains: | 73.0 |
| U.S. Average: | 214.2 |
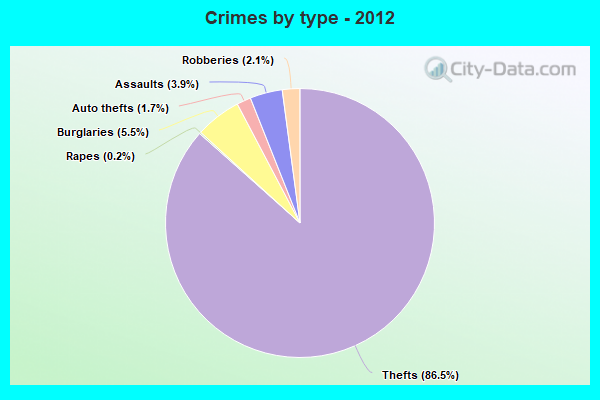
Violent crime rate in 2012
| White Plains: | 85.1 |
| U.S. Average: | 187.4 |
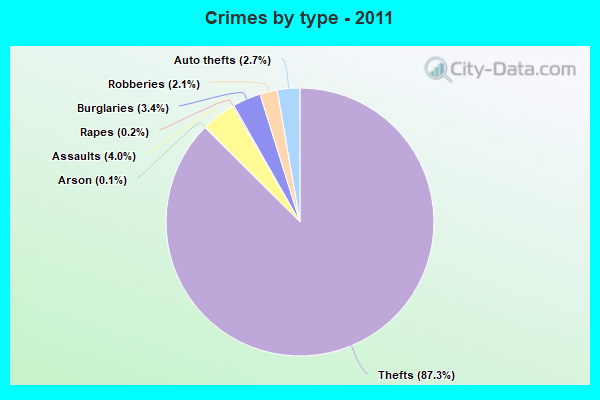
Violent crime rate in 2011
| White Plains: | 81.4 |
| U.S. Average: | 187.1 |
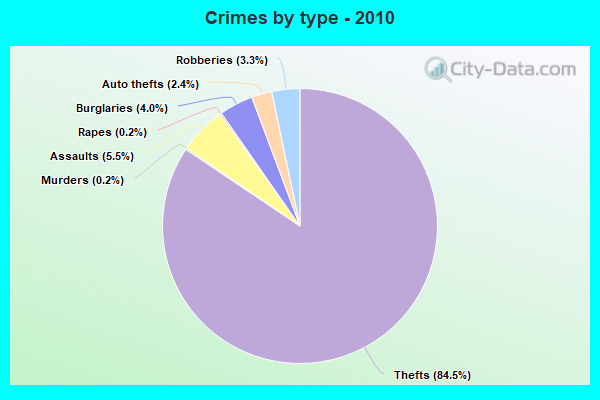
Violent crime rate in 2010
| White Plains: | 103.8 |
| U.S. Average: | 195.7 |
Violent crime rate in 2009
| White Plains: | 102.1 |
| U.S. Average: | 208.9 |
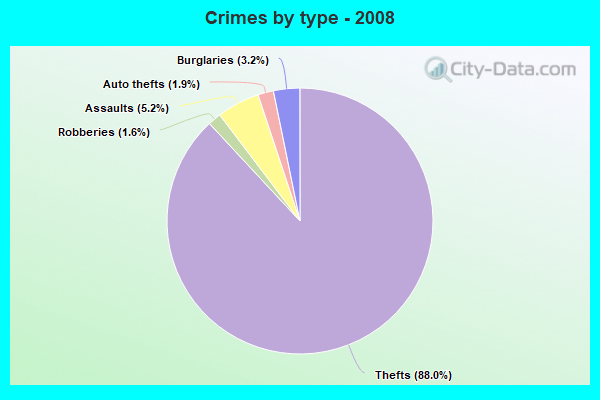
Violent crime rate in 2008
| White Plains: | 75.1 |
| U.S. Average: | 222.5 |
Violent crime rate in 2007
| White Plains: | 87.1 |
| U.S. Average: | 229.1 |
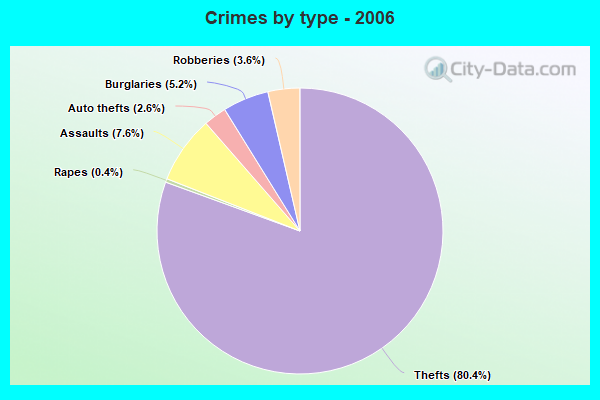
Violent crime rate in 2006
| White Plains: | 124.1 |
| U.S. Average: | 232.6 |
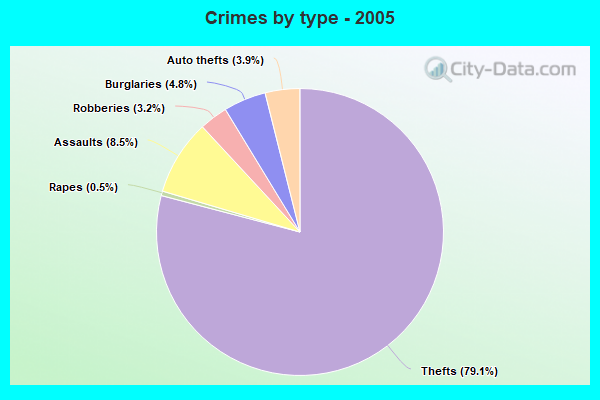
Violent crime rate in 2005
| White Plains: | 140.5 |
| U.S. Average: | 227.0 |
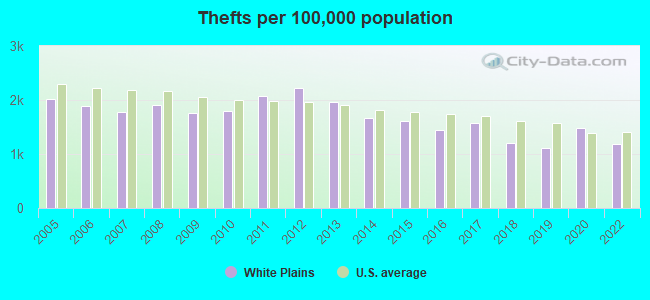
Property crime rate in 2022
| White Plains: | 76.1 |
| U.S. Average: | 166.5 |
Property crime rate in 2020
| White Plains: | 103.6 |
| U.S. Average: | 169.6 |
Property crime rate in 2019
| White Plains: | 69.9 |
| U.S. Average: | 179.7 |
Property crime rate in 2018
| White Plains: | 76.8 |
| U.S. Average: | 190.2 |
Property crime rate in 2017
| White Plains: | 98.2 |
| U.S. Average: | 206.4 |
Property crime rate in 2016
| White Plains: | 96.8 |
| U.S. Average: | 216.6 |
Property crime rate in 2015
| White Plains: | 105.7 |
| U.S. Average: | 221.5 |
Property crime rate in 2014
| White Plains: | 108.2 |
| U.S. Average: | 230.8 |
Property crime rate in 2013
| White Plains: | 130.7 |
| U.S. Average: | 250.4 |
Property crime rate in 2012
| White Plains: | 146.1 |
| U.S. Average: | 267.3 |
Property crime rate in 2011
| White Plains: | 129.3 |
| U.S. Average: | 273.5 |
Property crime rate in 2010
| White Plains: | 114.0 |
| U.S. Average: | 276.4 |
Property crime rate in 2009
| White Plains: | 110.4 |
| U.S. Average: | 285.6 |
Property crime rate in 2008
| White Plains: | 115.2 |
| U.S. Average: | 302.2 |
Property crime rate in 2007
| White Plains: | 97.3 |
| U.S. Average: | 309.2 |
Property crime rate in 2006
| White Plains: | 109.0 |
| U.S. Average: | 317.3 |
Property crime rate in 2005
| White Plains: | 119.2 |
| U.S. Average: | 322.3 |

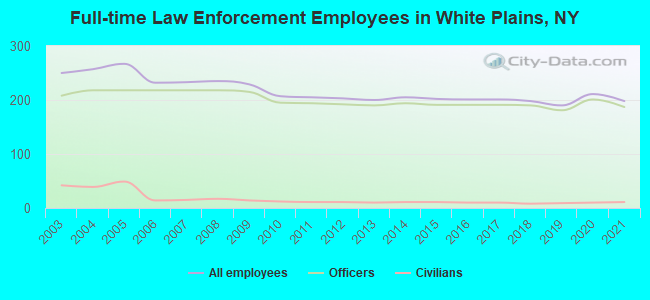
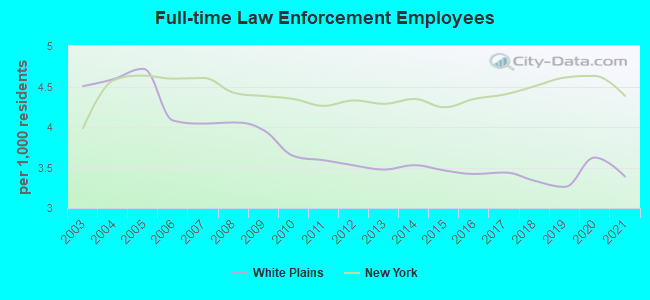
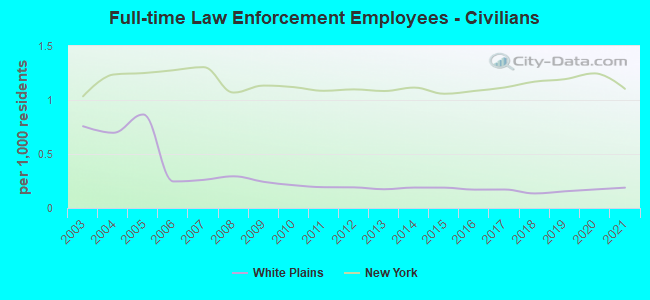
Full-time law enforcement employees in 2021, including police officers: 198 (187 officers - 151 male; 36 female).
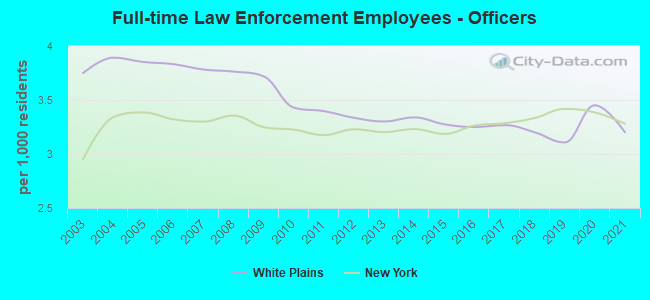
| Officers per 1,000 residents here: | 3.20 |
| New York average: | 3.28 |
Full-time law enforcement employees in 2020, including police officers: 211 (201 officers - 170 male; 31 female).
| Officers per 1,000 residents here: | 3.45 |
| New York average: | 3.38 |
Full-time law enforcement employees in 2019, including police officers: 190 (181 officers - 153 male; 28 female).
| Officers per 1,000 residents here: | 3.11 |
| New York average: | 3.42 |
Full-time law enforcement employees in 2018, including police officers: 198 (190 officers - 164 male; 26 female).
| Officers per 1,000 residents here: | 3.20 |
| New York average: | 3.33 |
Full-time law enforcement employees in 2017, including police officers: 201 (191 officers - 166 male; 25 female).
| Officers per 1,000 residents here: | 3.27 |
| New York average: | 3.28 |
Full-time law enforcement employees in 2016, including police officers: 201 (191 officers - 168 male; 23 female).
| Officers per 1,000 residents here: | 3.25 |
| New York average: | 3.26 |
Full-time law enforcement employees in 2015, including police officers: 202 (191 officers - 169 male; 22 female).
| Officers per 1,000 residents here: | 3.28 |
| New York average: | 3.19 |
Full-time law enforcement employees in 2014, including police officers: 205 (194 officers - 173 male; 21 female).
| Officers per 1,000 residents here: | 3.34 |
| New York average: | 3.23 |
Full-time law enforcement employees in 2013, including police officers: 200 (190 officers - 169 male; 21 female).
| Officers per 1,000 residents here: | 3.30 |
| New York average: | 3.20 |
Full-time law enforcement employees in 2012, including police officers: 203 (192 officers - 170 male; 22 female).
| Officers per 1,000 residents here: | 3.34 |
| New York average: | 3.23 |
Full-time law enforcement employees in 2011, including police officers: 205 (194 officers - 174 male; 20 female).
| Officers per 1,000 residents here: | 3.40 |
| New York average: | 3.18 |
Full-time law enforcement employees in 2010, including police officers: 207 (195 officers - 176 male; 19 female).
| Officers per 1,000 residents here: | 3.43 |
| New York average: | 3.23 |
Full-time law enforcement employees in 2009, including police officers: 229 (215 officers - 194 male; 21 female).
| Officers per 1,000 residents here: | 3.72 |
| New York average: | 3.25 |
Full-time law enforcement employees in 2008, including police officers: 235 (218 officers - 198 male; 20 female).
| Officers per 1,000 residents here: | 3.76 |
| New York average: | 3.36 |
Full-time law enforcement employees in 2007, including police officers: 233 (218 officers - 199 male; 19 female).
| Officers per 1,000 residents here: | 3.78 |
| New York average: | 3.30 |
Full-time law enforcement employees in 2006, including police officers: 232 (218 officers - 203 male; 15 female).
| Officers per 1,000 residents here: | 3.83 |
| New York average: | 3.32 |
Full-time law enforcement employees in 2005, including police officers: 267 (218 officers - 202 male; 16 female).
| Officers per 1,000 residents here: | 3.85 |
| New York average: | 3.39 |
Full-time law enforcement employees in 2004, including police officers: 257 (218 officers - 203 male; 15 female).
| Officers per 1,000 residents here: | 3.89 |
| New York average: | 3.34 |
Full-time law enforcement employees in 2003, including police officers: 250 (208 officers - 199 male; 9 female).
| Officers per 1,000 residents here: | 3.75 |
| New York average: | 2.95 |