Crime rate in Wilmington, North Carolina (NC): murders, rapes, robberies, assaults, burglaries, thefts, auto thefts, arson, law enforcement employees, police officers, crime map
Crime rate in Wilmington, NC
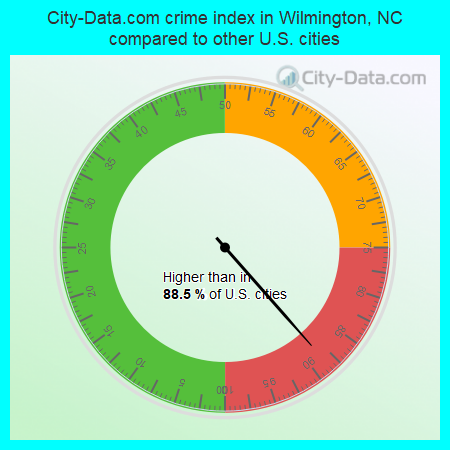
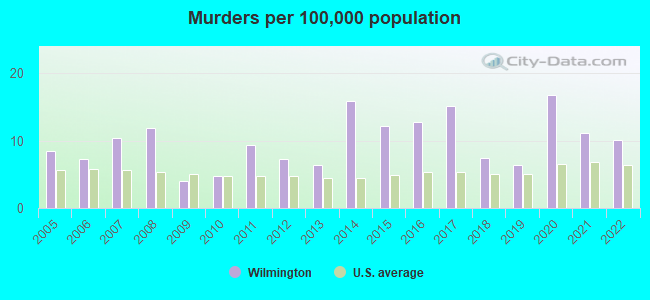
The 2022 crime rate in Wilmington, NC is 308 (City-Data.com crime index), which is 1.3 times greater than the U.S. average. It was higher than in 88.5% U.S. cities. The 2022 Wilmington crime rate rose by 0% compared to 2021. The number of homicides stood at 12 - a decrease of 2 compared to 2021. In the last 5 years Wilmington has seen decline of violent crime and decreasing property crime.See how dangerous Wilmington, NC is compared to the nearest cities:
(Note: Higher means more crime)
(Note: Higher means more crime)
| Wilmington: | 308.2 |
| Navassa: | 59.0 |
| Leland: | 44.3 |
| Wrightsville Beach: | 298.0 |
| Carolina Beach: | 264.4 |
| Northwest: | 225.1 |
| Boiling Spring Lakes: | 132.3 |
| Southport: | 126.3 |
| Burgaw: | 274.4 |

The City-Data.com crime index weighs serious crimes and violent crimes more heavily. Higher means more crime, U.S. average is 246.1. It adjusts for the number of visitors and daily workers commuting into cities.
- means the value is smaller than the state average.- means the value is about the same as the state average.
- means the value is bigger than the state average.
- means the value is much bigger than the state average.
According to our research of North Carolina and other state lists, there were 212 registered sex offenders living in Wilmington, North Carolina as of May 13, 2024.
The ratio of all residents to sex offenders in Wilmington is 548 to 1.
The ratio of registered sex offenders to all residents in this city is near the state average.
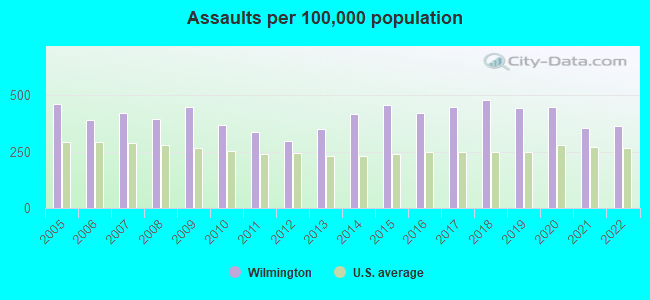
Violent crime rate in 2022
| Wilmington: | 313.4 |
| U.S. Average: | 219.8 |
Violent crime rate in 2021
| Wilmington: | 313.2 |
| U.S. Average: | 224.8 |
Violent crime rate in 2020
| Wilmington: | 375.6 |
| U.S. Average: | 228.2 |
Violent crime rate in 2019
| Wilmington: | 353.1 |
| U.S. Average: | 219.9 |
Violent crime rate in 2018
| Wilmington: | 350.2 |
| U.S. Average: | 221.2 |
Violent crime rate in 2017
| Wilmington: | 371.0 |
| U.S. Average: | 226.2 |
Violent crime rate in 2016
| Wilmington: | 359.8 |
| U.S. Average: | 227.3 |
Violent crime rate in 2015
| Wilmington: | 426.2 |
| U.S. Average: | 219.3 |
Violent crime rate in 2014
| Wilmington: | 377.4 |
| U.S. Average: | 211.1 |
Violent crime rate in 2013
| Wilmington: | 336.5 |
| U.S. Average: | 214.2 |
Violent crime rate in 2012
| Wilmington: | 304.0 |
| U.S. Average: | 187.4 |
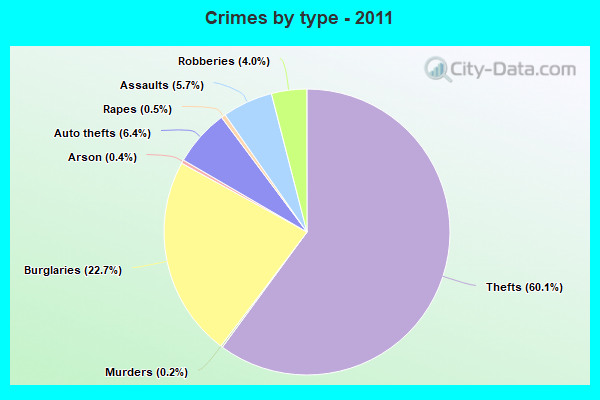
Violent crime rate in 2011
| Wilmington: | 335.7 |
| U.S. Average: | 187.1 |
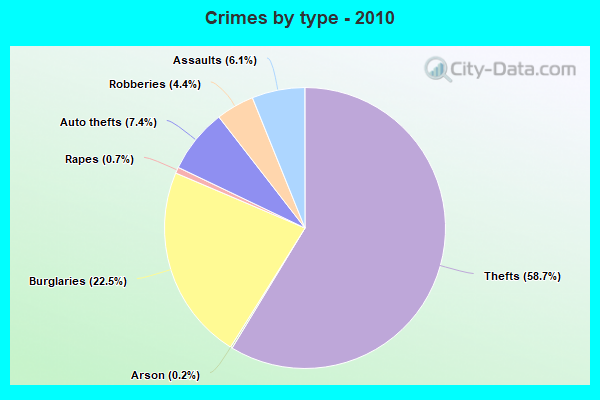
Violent crime rate in 2010
| Wilmington: | 369.1 |
| U.S. Average: | 195.7 |
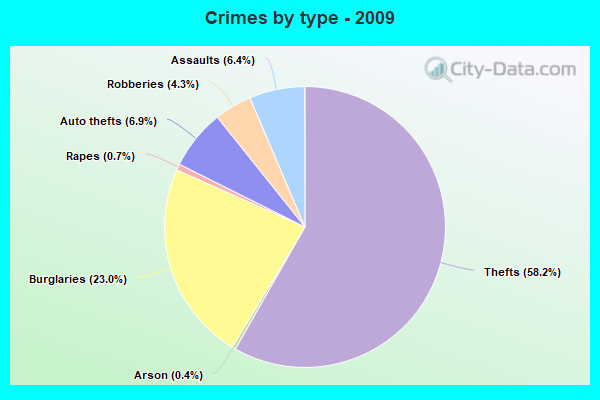
Violent crime rate in 2009
| Wilmington: | 431.8 |
| U.S. Average: | 208.9 |
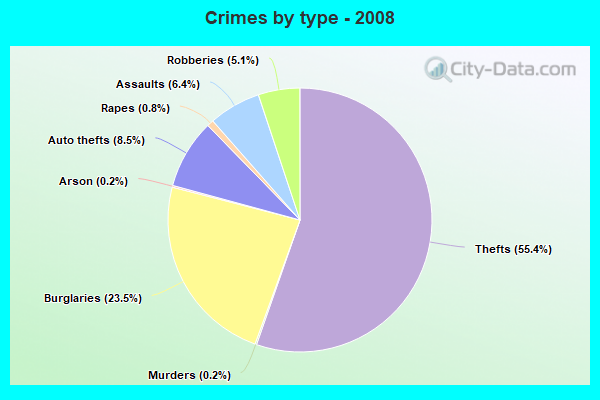
Violent crime rate in 2008
| Wilmington: | 427.5 |
| U.S. Average: | 222.5 |
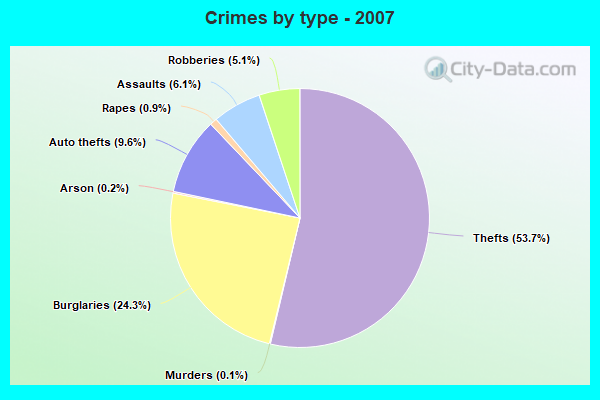
Violent crime rate in 2007
| Wilmington: | 303.2 |
| U.S. Average: | 229.1 |
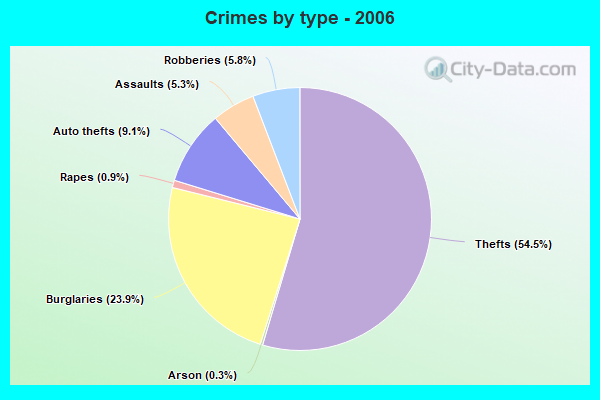
Violent crime rate in 2006
| Wilmington: | 312.0 |
| U.S. Average: | 232.6 |
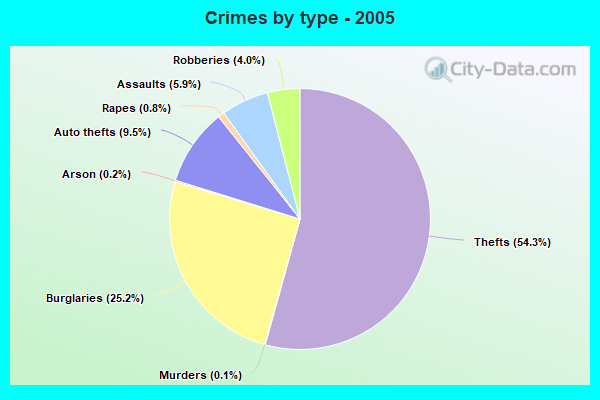
Violent crime rate in 2005
| Wilmington: | 298.2 |
| U.S. Average: | 227.0 |
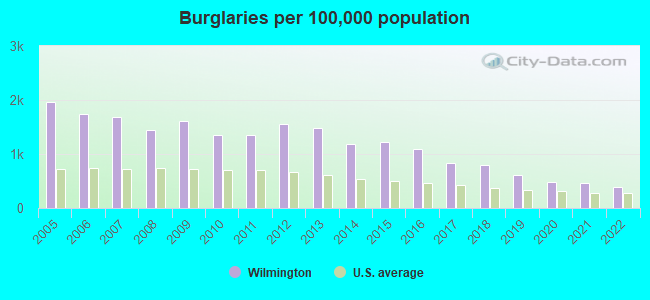
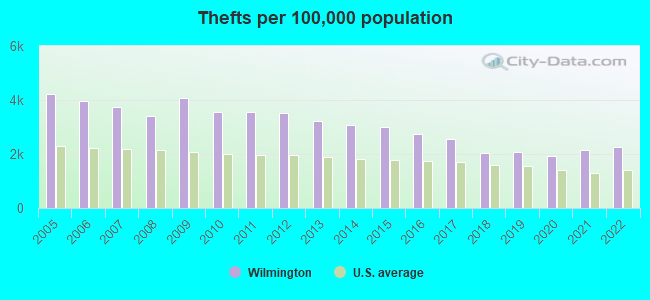
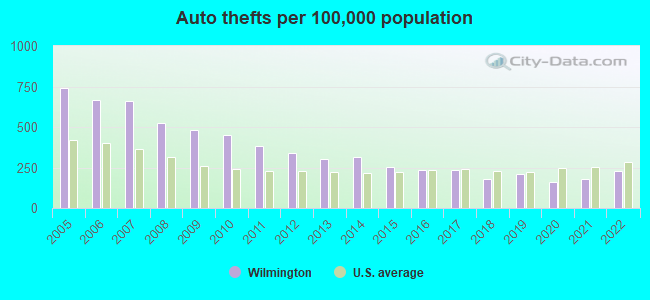
Property crime rate in 2022
| Wilmington: | 225.1 |
| U.S. Average: | 166.5 |
Property crime rate in 2021
| Wilmington: | 225.8 |
| U.S. Average: | 157.8 |
Property crime rate in 2020
| Wilmington: | 214.9 |
| U.S. Average: | 169.6 |
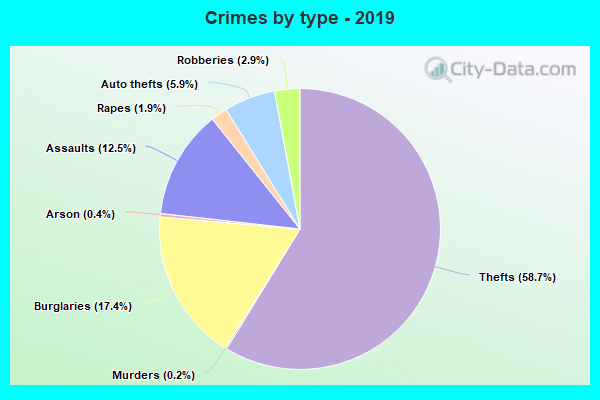
Property crime rate in 2019
| Wilmington: | 259.1 |
| U.S. Average: | 179.7 |
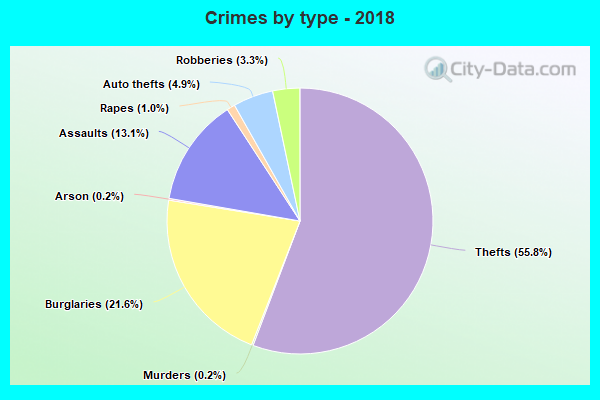
Property crime rate in 2018
| Wilmington: | 286.8 |
| U.S. Average: | 190.2 |
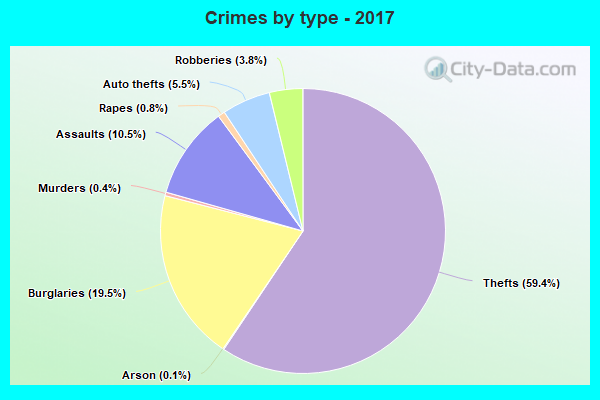
Property crime rate in 2017
| Wilmington: | 329.7 |
| U.S. Average: | 206.4 |
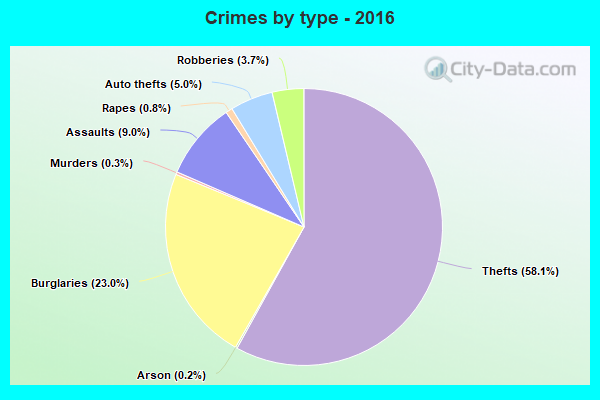
Property crime rate in 2016
| Wilmington: | 388.3 |
| U.S. Average: | 216.6 |
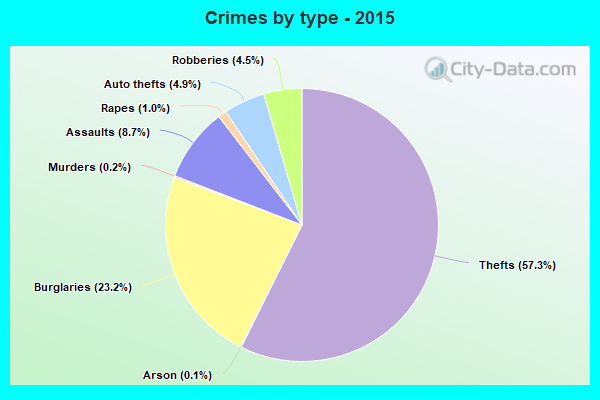
Property crime rate in 2015
| Wilmington: | 432.0 |
| U.S. Average: | 221.5 |
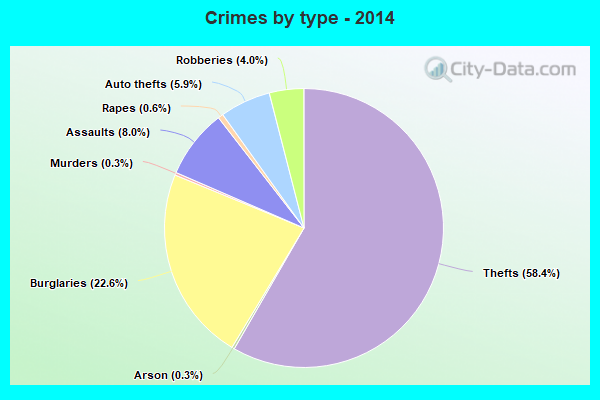
Property crime rate in 2014
| Wilmington: | 436.8 |
| U.S. Average: | 230.8 |
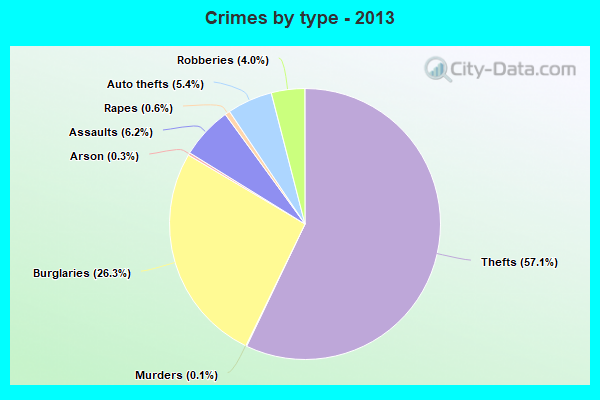
Property crime rate in 2013
| Wilmington: | 502.5 |
| U.S. Average: | 250.4 |
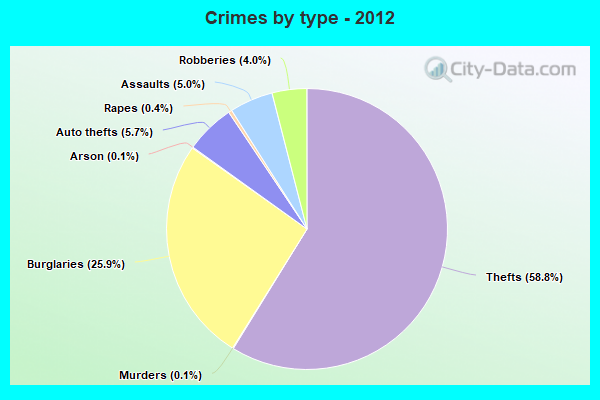
Property crime rate in 2012
| Wilmington: | 536.6 |
| U.S. Average: | 267.3 |
Property crime rate in 2011
| Wilmington: | 505.1 |
| U.S. Average: | 273.5 |
Property crime rate in 2010
| Wilmington: | 516.7 |
| U.S. Average: | 276.4 |
Property crime rate in 2009
| Wilmington: | 596.2 |
| U.S. Average: | 285.6 |
Property crime rate in 2008
| Wilmington: | 539.8 |
| U.S. Average: | 302.2 |
Property crime rate in 2007
| Wilmington: | 403.3 |
| U.S. Average: | 309.2 |
Property crime rate in 2006
| Wilmington: | 417.8 |
| U.S. Average: | 317.3 |
Property crime rate in 2005
| Wilmington: | 461.1 |
| U.S. Average: | 322.3 |
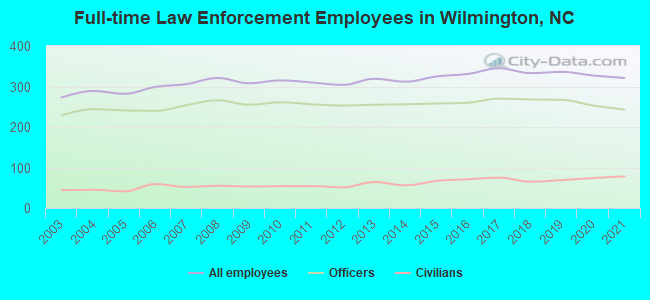
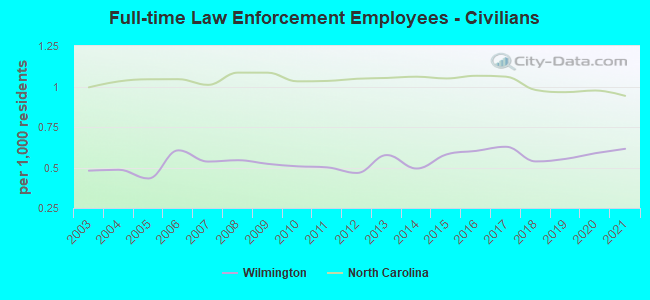
Full-time law enforcement employees in 2021, including police officers: 321 (243 officers - 204 male; 39 female).
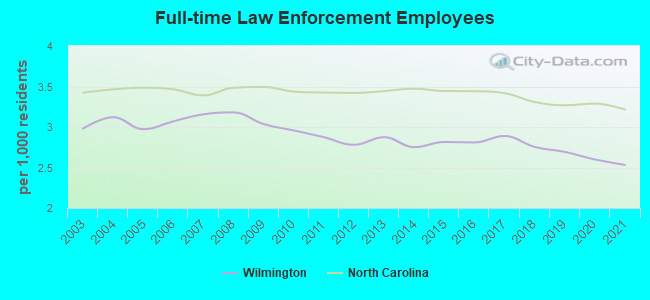
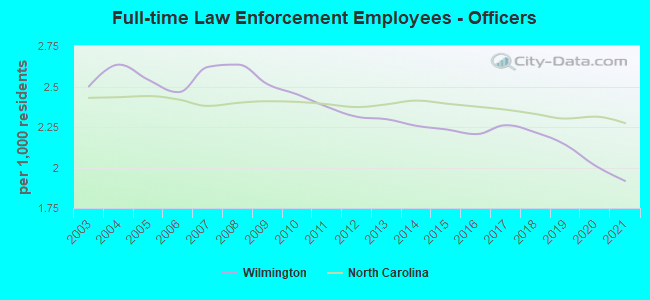
| Officers per 1,000 residents here: | 1.92 |
| North Carolina average: | 2.27 |
Full-time law enforcement employees in 2020, including police officers: 327 (253 officers - 210 male; 43 female).
| Officers per 1,000 residents here: | 2.01 |
| North Carolina average: | 2.31 |
Full-time law enforcement employees in 2019, including police officers: 336 (267 officers - 222 male; 45 female).
| Officers per 1,000 residents here: | 2.14 |
| North Carolina average: | 2.30 |
Full-time law enforcement employees in 2018, including police officers: 333 (268 officers - 225 male; 43 female).
| Officers per 1,000 residents here: | 2.22 |
| North Carolina average: | 2.33 |
Full-time law enforcement employees in 2017, including police officers: 345 (270 officers - 225 male; 45 female).
| Officers per 1,000 residents here: | 2.26 |
| North Carolina average: | 2.36 |
Full-time law enforcement employees in 2016, including police officers: 331 (260 officers - 219 male; 41 female).
| Officers per 1,000 residents here: | 2.21 |
| North Carolina average: | 2.38 |
Full-time law enforcement employees in 2015, including police officers: 325 (258 officers - 217 male; 41 female).
| Officers per 1,000 residents here: | 2.24 |
| North Carolina average: | 2.39 |
Full-time law enforcement employees in 2014, including police officers: 312 (256 officers - 214 male; 42 female).
| Officers per 1,000 residents here: | 2.26 |
| North Carolina average: | 2.41 |
Full-time law enforcement employees in 2013, including police officers: 319 (255 officers - 215 male; 40 female).
| Officers per 1,000 residents here: | 2.30 |
| North Carolina average: | 2.39 |
Full-time law enforcement employees in 2012, including police officers: 304 (253 officers - 211 male; 42 female).
| Officers per 1,000 residents here: | 2.31 |
| North Carolina average: | 2.37 |
Full-time law enforcement employees in 2011, including police officers: 310 (256 officers - 213 male; 43 female).
| Officers per 1,000 residents here: | 2.37 |
| North Carolina average: | 2.39 |
Full-time law enforcement employees in 2010, including police officers: 315 (261 officers - 218 male; 43 female).
| Officers per 1,000 residents here: | 2.45 |
| North Carolina average: | 2.40 |
Full-time law enforcement employees in 2009, including police officers: 308 (255 officers - 215 male; 40 female).
| Officers per 1,000 residents here: | 2.51 |
| North Carolina average: | 2.41 |
Full-time law enforcement employees in 2008, including police officers: 321 (266 officers - 222 male; 44 female).
| Officers per 1,000 residents here: | 2.64 |
| North Carolina average: | 2.40 |
Full-time law enforcement employees in 2007, including police officers: 306 (254 officers - 218 male; 36 female).
| Officers per 1,000 residents here: | 2.62 |
| North Carolina average: | 2.38 |
Full-time law enforcement employees in 2006, including police officers: 299 (240 officers - 207 male; 33 female).
| Officers per 1,000 residents here: | 2.46 |
| North Carolina average: | 2.42 |
Full-time law enforcement employees in 2005, including police officers: 282 (241 officers - 207 male; 34 female).
| Officers per 1,000 residents here: | 2.54 |
| North Carolina average: | 2.44 |
Full-time law enforcement employees in 2004, including police officers: 289 (244 officers - 212 male; 32 female).
| Officers per 1,000 residents here: | 2.64 |
| North Carolina average: | 2.43 |
Full-time law enforcement employees in 2003, including police officers: 273 (229 officers - 201 male; 28 female).
| Officers per 1,000 residents here: | 2.50 |
| North Carolina average: | 2.43 |
Zip codes: 28403.