Crime rate in Youngstown, Ohio (OH): murders, rapes, robberies, assaults, burglaries, thefts, auto thefts, arson, law enforcement employees, police officers, crime map
Crime rate in Youngstown, OH
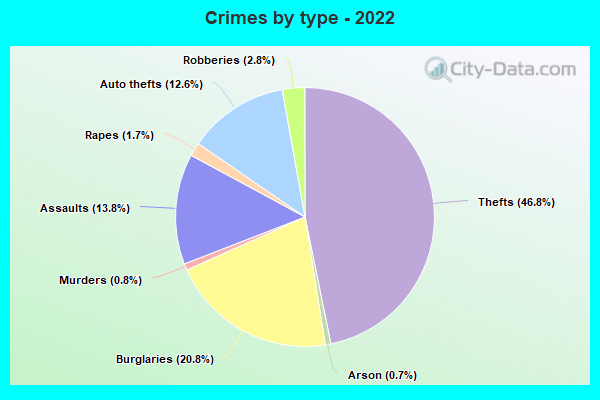
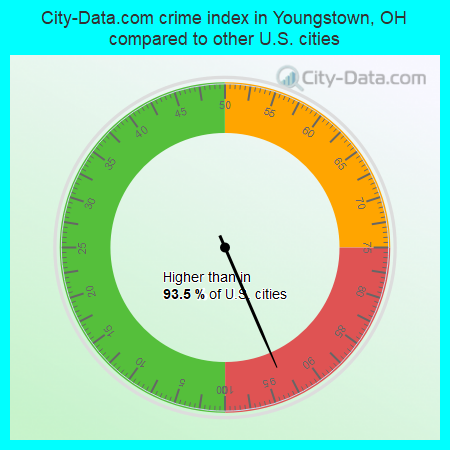
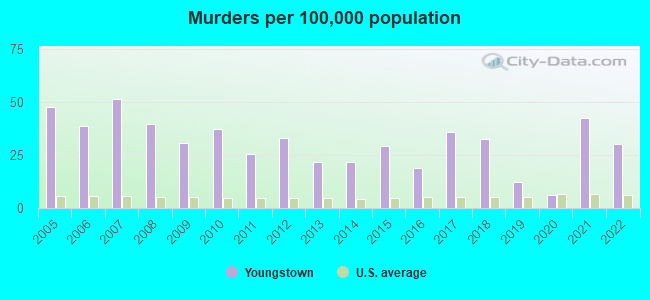
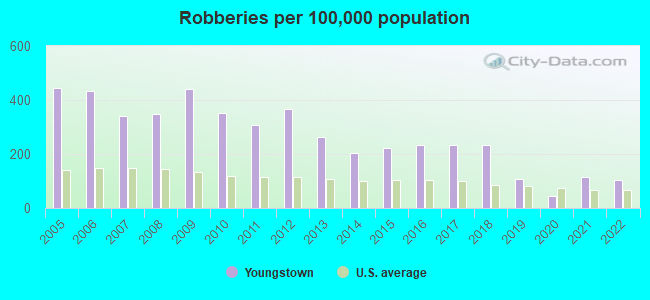
The 2022 crime rate in Youngstown, OH is 393 (City-Data.com crime index), which is 1.6 times higher than the U.S. average. It was higher than in 93.5% U.S. cities. The 2022 Youngstown crime rate fell by 8% compared to 2021. The number of homicides stood at 18 - a decrease of 9 compared to 2021. In the last 5 years Youngstown has seen increasing violent crime and decreasing property crime.See how dangerous Youngstown, OH is compared to the nearest cities:
(Note: Higher means more crime)
(Note: Higher means more crime)
| Youngstown: | 392.6 |
| Campbell: | 25.2 |
| Boardman: | 252.3 |
| Struthers: | 57.4 |
| Austintown: | 121.1 |
| Girard: | 18.6 |
| Poland: | 21.6 |
| Hubbard: | 101.5 |
| Lowellville: | 8.2 |
The City-Data.com crime index weighs serious crimes and violent crimes more heavily. Higher means more crime, U.S. average is 246.1. It adjusts for the number of visitors and daily workers commuting into cities.
- means the value is smaller than the state average.- means the value is about the same as the state average.
- means the value is bigger than the state average.
- means the value is much bigger than the state average.
According to our research of Ohio and other state lists, there were 365 registered sex offenders living in Youngstown, Ohio as of April 25, 2024.
The ratio of all residents to sex offenders in Youngstown is 176 to 1.
Violent crime rate in 2022
| Youngstown: | 417.9 |
| U.S. Average: | 219.8 |
Violent crime rate in 2021
| Youngstown: | 494.2 |
| U.S. Average: | 224.8 |
Violent crime rate in 2020
| Youngstown: | 87.3 |
| U.S. Average: | 228.2 |
Violent crime rate in 2019
| Youngstown: | 227.1 |
| U.S. Average: | 219.9 |
Violent crime rate in 2018
| Youngstown: | 403.7 |
| U.S. Average: | 221.2 |
Violent crime rate in 2017
| Youngstown: | 427.3 |
| U.S. Average: | 226.2 |
Violent crime rate in 2016
| Youngstown: | 381.7 |
| U.S. Average: | 227.3 |
Violent crime rate in 2015
| Youngstown: | 442.7 |
| U.S. Average: | 219.3 |
Violent crime rate in 2014
| Youngstown: | 391.2 |
| U.S. Average: | 211.1 |
Violent crime rate in 2013
| Youngstown: | 459.7 |
| U.S. Average: | 214.2 |
Violent crime rate in 2012
| Youngstown: | 593.4 |
| U.S. Average: | 187.4 |
Violent crime rate in 2011
| Youngstown: | 522.9 |
| U.S. Average: | 187.1 |
Violent crime rate in 2010
| Youngstown: | 594.9 |
| U.S. Average: | 195.7 |
Violent crime rate in 2009
| Youngstown: | 672.8 |
| U.S. Average: | 208.9 |
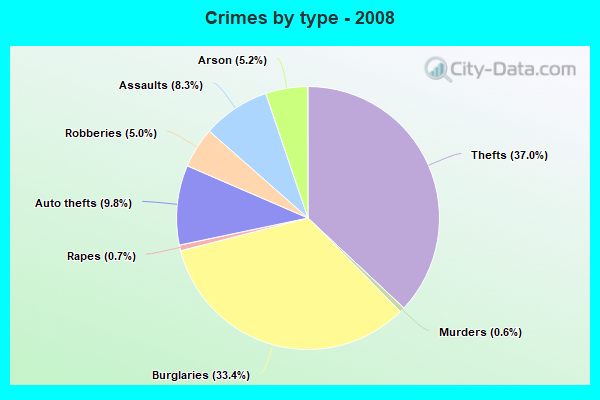
Violent crime rate in 2008
| Youngstown: | 587.2 |
| U.S. Average: | 222.5 |
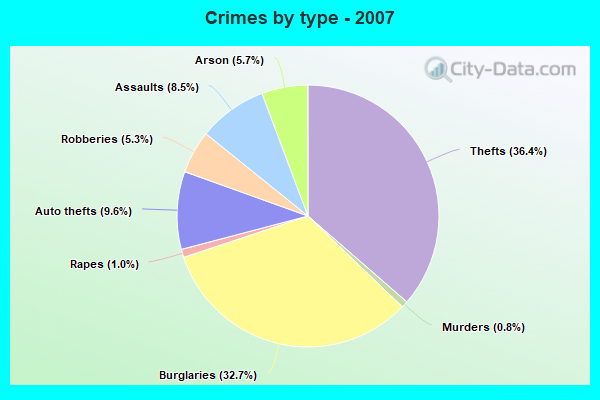
Violent crime rate in 2007
| Youngstown: | 499.7 |
| U.S. Average: | 229.1 |
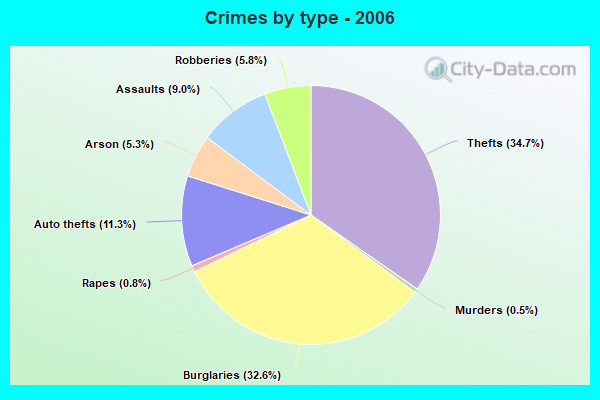
Violent crime rate in 2006
| Youngstown: | 561.9 |
| U.S. Average: | 232.6 |
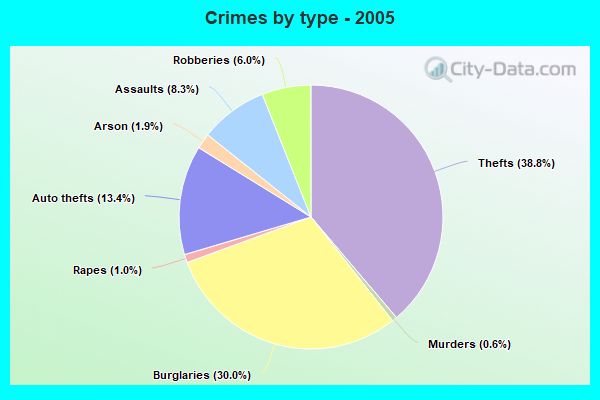
Violent crime rate in 2005
| Youngstown: | 575.1 |
| U.S. Average: | 227.0 |
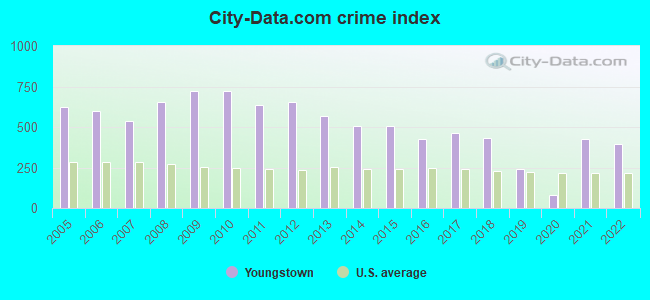
Property crime rate in 2022
| Youngstown: | 300.4 |
| U.S. Average: | 166.5 |
Property crime rate in 2021
| Youngstown: | 246.2 |
| U.S. Average: | 157.8 |
Property crime rate in 2020
| Youngstown: | 59.6 |
| U.S. Average: | 169.6 |
Property crime rate in 2019
| Youngstown: | 207.4 |
| U.S. Average: | 179.7 |
Property crime rate in 2018
| Youngstown: | 400.5 |
| U.S. Average: | 190.2 |
Property crime rate in 2017
| Youngstown: | 420.5 |
| U.S. Average: | 206.4 |
Property crime rate in 2016
| Youngstown: | 442.4 |
| U.S. Average: | 216.6 |
Property crime rate in 2015
| Youngstown: | 534.9 |
| U.S. Average: | 221.5 |
Property crime rate in 2014
| Youngstown: | 623.3 |
| U.S. Average: | 230.8 |
Property crime rate in 2013
| Youngstown: | 708.6 |
| U.S. Average: | 250.4 |
Property crime rate in 2012
| Youngstown: | 709.5 |
| U.S. Average: | 267.3 |
Property crime rate in 2011
| Youngstown: | 803.0 |
| U.S. Average: | 273.5 |
Property crime rate in 2010
| Youngstown: | 879.3 |
| U.S. Average: | 276.4 |
Property crime rate in 2009
| Youngstown: | 794.2 |
| U.S. Average: | 285.6 |
Property crime rate in 2008
| Youngstown: | 692.6 |
| U.S. Average: | 302.2 |
Property crime rate in 2007
| Youngstown: | 514.2 |
| U.S. Average: | 309.2 |
Property crime rate in 2006
| Youngstown: | 609.5 |
| U.S. Average: | 317.3 |
Property crime rate in 2005
| Youngstown: | 600.8 |
| U.S. Average: | 322.3 |
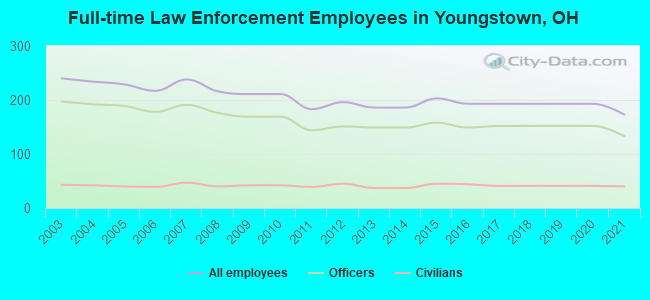
Full-time law enforcement employees in 2021, including police officers: 173 (133 officers - 119 male; 14 female).
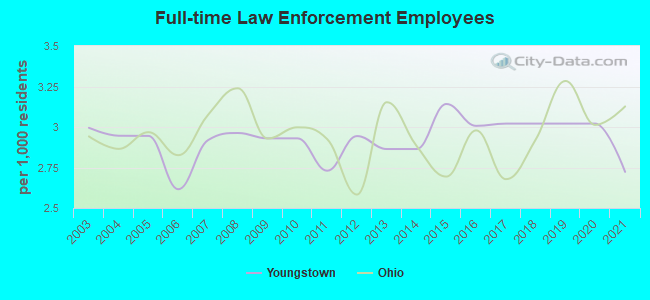
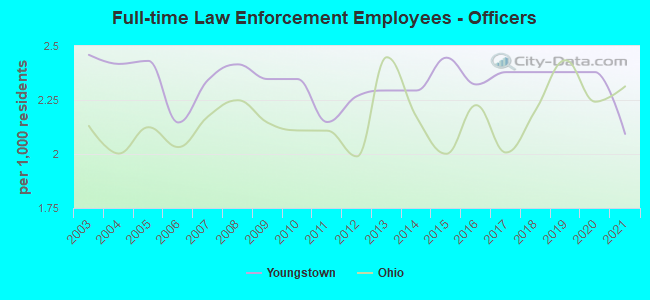
| Officers per 1,000 residents here: | 2.09 |
| Ohio average: | 2.31 |
Full-time law enforcement employees in 2017, including police officers: 193 (152 officers - 136 male; 16 female).
| Officers per 1,000 residents here: | 2.38 |
| Ohio average: | 2.01 |
Full-time law enforcement employees in 2016, including police officers: 193 (149 officers - 134 male; 15 female).
| Officers per 1,000 residents here: | 2.32 |
| Ohio average: | 2.23 |
Full-time law enforcement employees in 2015, including police officers: 203 (158 officers - 141 male; 17 female).
| Officers per 1,000 residents here: | 2.45 |
| Ohio average: | 2.00 |
Full-time law enforcement employees in 2013, including police officers: 186 (149 officers - 134 male; 15 female).
| Officers per 1,000 residents here: | 2.29 |
| Ohio average: | 2.45 |
Full-time law enforcement employees in 2012, including police officers: 196 (151 officers - 135 male; 16 female).
| Officers per 1,000 residents here: | 2.27 |
| Ohio average: | 1.99 |
Full-time law enforcement employees in 2011, including police officers: 183 (144 officers - 128 male; 16 female).
| Officers per 1,000 residents here: | 2.15 |
| Ohio average: | 2.11 |
Full-time law enforcement employees in 2009, including police officers: 211 (169 officers - 151 male; 18 female).
| Officers per 1,000 residents here: | 2.35 |
| Ohio average: | 2.15 |
Full-time law enforcement employees in 2008, including police officers: 216 (176 officers - 159 male; 17 female).
| Officers per 1,000 residents here: | 2.41 |
| Ohio average: | 2.25 |
Full-time law enforcement employees in 2007, including police officers: 238 (191 officers - 167 male; 24 female).
| Officers per 1,000 residents here: | 2.34 |
| Ohio average: | 2.17 |
Full-time law enforcement employees in 2006, including police officers: 217 (178 officers - 160 male; 18 female).
| Officers per 1,000 residents here: | 2.15 |
| Ohio average: | 2.03 |
Full-time law enforcement employees in 2005, including police officers: 229 (189 officers - 170 male; 19 female).
| Officers per 1,000 residents here: | 2.43 |
| Ohio average: | 2.12 |
Full-time law enforcement employees in 2004, including police officers: 234 (192 officers - 174 male; 18 female).
| Officers per 1,000 residents here: | 2.42 |
| Ohio average: | 2.00 |
Full-time law enforcement employees in 2003, including police officers: 240 (197 officers - 179 male; 18 female).
| Officers per 1,000 residents here: | 2.46 |
| Ohio average: | 2.13 |