Albany: Fire Incidents, Indiana (IN)
Where are fire incidents reported in Albany, IN
Something went wrong! Please refresh the page.
|
| |||||||||||||||||||||||||||||||||||||||||||||||||||||||||||||||||||||||||||||||||||||||||||||||||||||||||||||
2004 - 2018 National Fire Incident Reporting System (NFIRS) incidents
- Incident types reported to NFIRS in Albany, IN
- 28834.6%Fire
- 21325.6%Hazardous Condition
- 18722.4%Rescue & EMS
- 9711.6%Good Intent Call
- 364.3%Service Call
- 81.0%False Alarm
- 20.2%Special Incident
- 10.1%Overpressure Rupture
- 10.1%Severe Weather
- Fire incident types reported to NFIRS in Albany, IN
- 14349.7%Outside Fires
- 11539.9%Structure Fires
- 279.4%Mobile Property/Vehicle Fires
- 31.0%Other
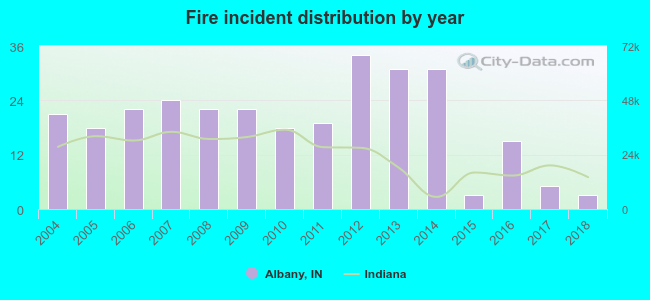 According to the data from the years 2004 - 2018 the average number of fires per year is 19. The highest number of fires - 34 took place in 2012, and the least - 3 in 2015. The data has a dropping trend.
 According to the data from the years 2004 - 2018 the average number of fire-related yearly casualties is 0. The highest number of casualties - 2 took place in 2012, and the lowest - 0 in 2004. The data has a constant trend.
 25.7% incidents where reported in the morning and 74.3% in the evening. The most fires (18.4%) took place on Sunday, and the least (8.3%) on Friday.
 According to the 288 fire incident reports from years 2004 - 2018 most fires (15.3%) took place during July, and the least (3.5%) in January.
 Out of all 833 cases reported during the years 2004 - 2018, the most belonged to the categories: Fire (34.6%), Hazardous Condition (25.6%), and Rescue & EMS (22.4%).
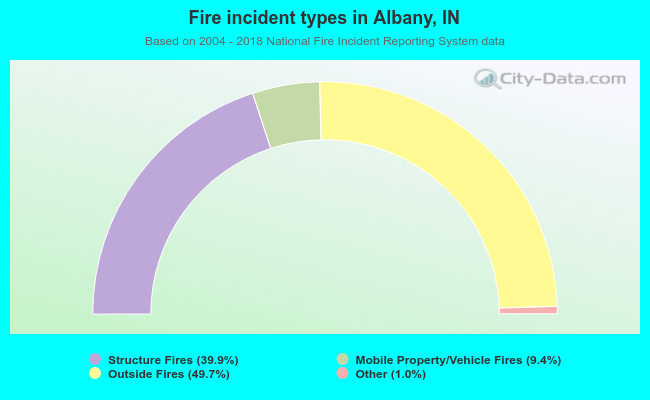 When looking into fire subcategories, the most incidents belonged to: Outside Fires (49.7%), and Structure Fires (39.9%).