Albert Lea: Fire Incidents, Minnesota (MN)
Where are fire incidents reported in Albert Lea, MN
Something went wrong! Please refresh the page.
| Fire incidents reported | |
|---|---|
| Sreet name | Count |
| MAIN ST | 96 |
| BROADWAY AVE | 78 |
| BRIDGE AVE | 70 |
| FRONT ST | 54 |
| WILLIAM ST | 40 |
| GARFIELD AVE | 32 |
| 1ST AVE | 26 |
| 4TH AVE | 26 |
| COLLEGE ST | 26 |
| FOUNTAIN ST | 26 |
| JAMES AVE | 22 |
| CLARK ST | 20 |
| RICHWAY DR | 20 |
| 9TH ST | 18 |
| JANSON ST | 18 |
| 3RD ST | 16 |
| FRANK AVE | 16 |
| JOHNSON ST | 16 |
| MADISON AVE | 16 |
| ADAMS AVE | 14 |
| JEFFERSON AVE | 14 |
| NEWTON AVE | 14 |
| PLAINVIEW LANE | 14 |
| ST PETER AVE | 14 |
| 4TH ST | 12 |
| COLUMBUS AVE | 12 |
| LARIMORE CIR | 12 |
| PLAZA ST | 12 |
| 11TH ST | 10 |
| 14TH ST | 10 |
| Other | 166 |
2002 - 2018 National Fire Incident Reporting System (NFIRS) incidents
- Incident types reported to NFIRS in Albert Lea, MN
- 5,27150.2%Rescue & EMS
- 1,41913.5%Hazardous Condition
- 1,39113.3%Service Call
- 9409.0%Fire
- 7387.0%Good Intent Call
- 6886.6%False Alarm
- 260.2%Overpressure Rupture
- Fire incident types reported to NFIRS in Albert Lea, MN
- 44747.6%Structure Fires
- 26027.7%Outside Fires
- 20321.6%Mobile Property/Vehicle Fires
- 303.2%Other
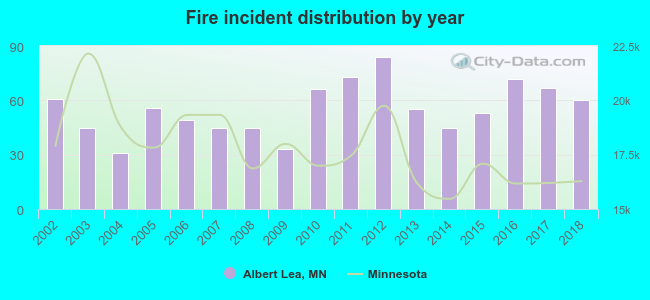 According to the data from the years 2002 - 2018 the average number of fires per year is 55. The highest number of fire incidents - 84 took place in 2012, and the least - 31 in 2004. The data has a declining trend.
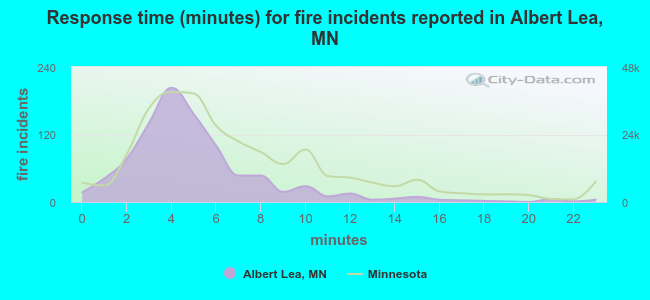 The median response time based on all reported fire incidents is 4 minutes. This is lower compared to the state median value.
The median response time in Albert Lea, MN compared to nearest cities:
(Note: Based on data for all years, including only cities with at least 500 fire incidents)
| Albert Lea: | 4 minutes |
| Austin: | 5 minutes |
| Waseca: | 6 minutes |
| Owatonna: | 5 minutes |
| Clear Lake: | 8 minutes |
| Mason City: | 5 minutes |
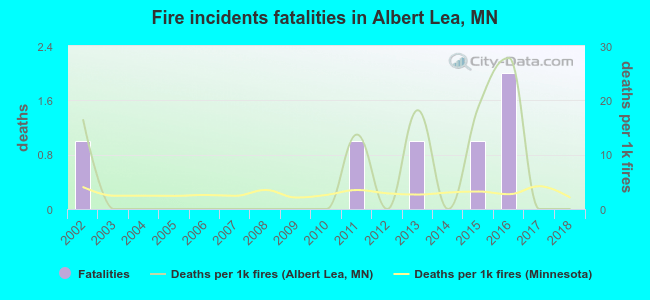 According to the reports from the years 2002 - 2018 the average number of fire-related fatalities per year is 0. The highest number of reported deaths - 2 took place in 2016, and the lowest - 0 in 2003. The data has a dropping trend.
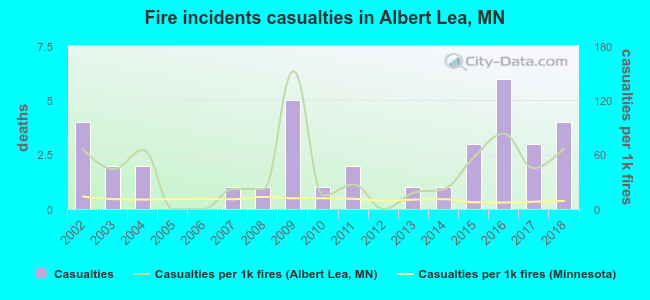 Based on the reports from the years 2002 - 2018 the average number of fire-related casualties per year is 2. The highest number of injuries - 6 took place in 2016, and the lowest - 0 in 2005. The data has a constant trend.
The average number of injuries per 1,000 fires is 41. This indicator was the highest - 152 in 2009, and the lowest 0 in 2005. The trend for casualties per 1,000 incidents is growing. Compared to the state value the number of injuries per 1,000 fire incidents is much higher.
Based on the reports from the years 2002 - 2018 the average number of fire-related casualties per year is 2. The highest number of injuries - 6 took place in 2016, and the lowest - 0 in 2005. The data has a constant trend.
The average number of injuries per 1,000 fires is 41. This indicator was the highest - 152 in 2009, and the lowest 0 in 2005. The trend for casualties per 1,000 incidents is growing. Compared to the state value the number of injuries per 1,000 fire incidents is much higher.Casualties per 1,000 incidents in Albert Lea, MN compared to nearest cities:
(Note: Based on data for all years, including only cities with at least 500 fire incidents)
| Albert Lea: | 38.3 |
| Austin: | 18.9 |
| Waseca: | 2.8 |
| Owatonna: | 14.4 |
| Clear Lake: | 17.2 |
| Mason City: | 21.7 |
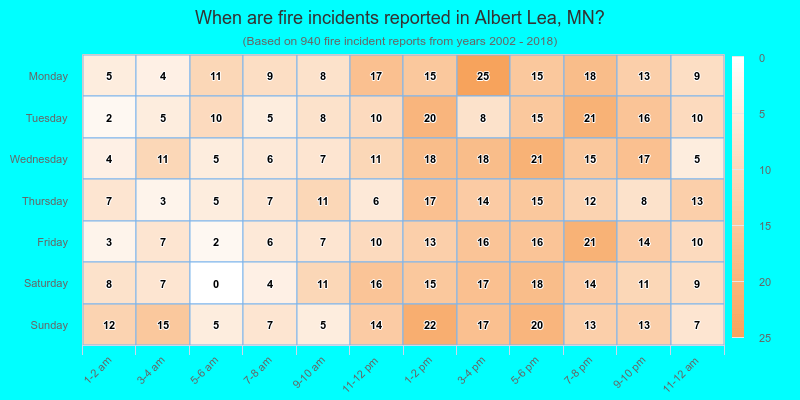
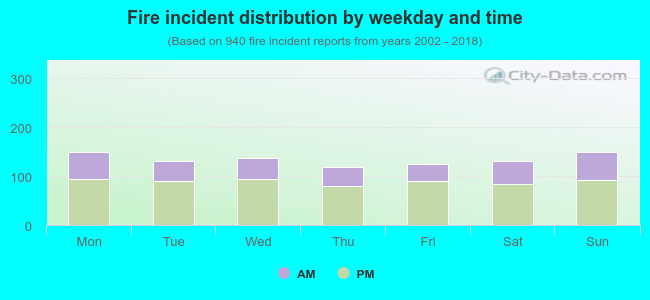 33.6% incidents where reported in the morning and 66.4% in the evening. The most fires (16.0%) took place on Sunday, and the least (12.6%) on Thursday.
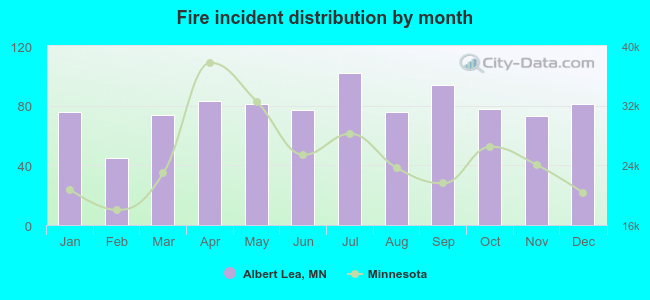 According to the 940 fire incidents from years 2002 - 2018 most fires (10.9%) took place during July, and the least (4.8%) in February.
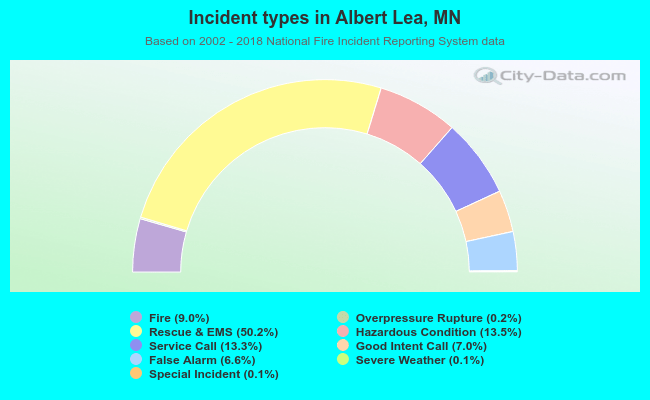 Out of all 10,492 cases reported during the years 2002 - 2018, the most belonged to the categories: Rescue & EMS (50.2%), Hazardous Condition (13.5%), and Service Call (13.3%).
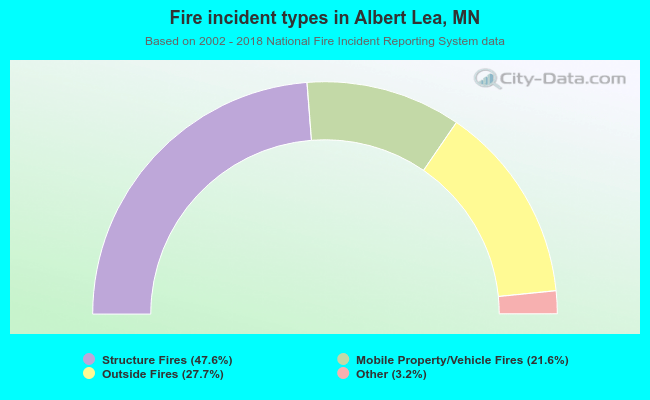 When looking into fire subcategories, the most incidents belonged to: Structure Fires (47.6%), and Outside Fires (27.7%).