Alford: Fire Incidents, Florida (FL)
Where are fire incidents reported in Alford, FL
Something went wrong! Please refresh the page.
|
| |||||||||||||||||||||||||||||||||||||||||||||||||||||||||||||||||||||||||||||||||||||||||||||||||||||||||||||
| Other | 95 | |||||||||||||||||||||||||||||||||||||||||||||||||||||||||||||||||||||||||||||||||||||||||||||||||||||||||||||
2002 - 2018 National Fire Incident Reporting System (NFIRS) incidents
- Incident types reported to NFIRS in Alford, FL
- 1,02759.9%Rescue & EMS
- 40923.9%Fire
- 1388.1%Good Intent Call
- 492.9%False Alarm
- 442.6%Hazardous Condition
- 261.5%Service Call
- 150.9%Special Incident
- 50.3%Severe Weather
- Fire incident types reported to NFIRS in Alford, FL
- 19748.2%Outside Fires
- 12029.3%Structure Fires
- 6215.2%Mobile Property/Vehicle Fires
- 307.3%Other
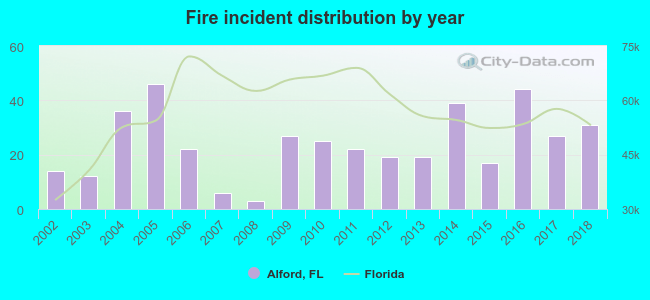 Based on the data from the years 2002 - 2018 the average number of fire incidents per year is 24. The highest number of fire incidents - 46 took place in 2005, and the least - 3 in 2008. The data has an increasing trend.
 33.0% incidents where reported in the morning and 67.0% in the evening. The most fires (17.8%) took place on Saturday, and the least (11.2%) on Friday.
 According to the 409 fire incident reports from years 2002 - 2018 most fires (16.4%) took place during March, and the least (3.4%) in July.
 Out of all 1,714 cases reported during the years 2002 - 2018, the most belonged to the categories: Rescue & EMS (59.9%), Fire (23.9%), and Good Intent Call (8.1%).
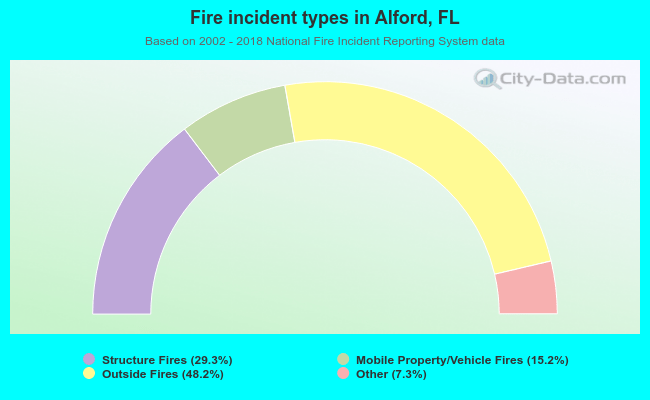 When looking into fire subcategories, the most reports belonged to: Outside Fires (48.2%), and Structure Fires (29.3%).