| Fire incidents reported |
|---|
| Sreet name | Count |
|---|
| COMMISSIONERS PIKE | 34 | | GREENWICH ST | 32 | | WATSONS MILL RD | 20 | | BEAL RD | 18 | | STOCKINGTON RD | 18 | | ALLOWAY-FRIESBURG RD | 14 | | MAIN ST | 14 | | ALLOWAY-ALDINE RD | 10 | | PLEASANT HILL RD | 10 | | SAWMILL RD | 10 | | TIMBERMAN RD | 10 | | ALDINE-DARETOWN RD | 8 | | PECKS CORNER COHANSEY RD | 8 | | ALLOWAY ALDINE RD | 6 | | ALLOWAY FRIESBURG RD | 6 | | ALLOWAY-WOODSTOWN RD | 6 | | CANHOUSE RD | 6 | | KERLIN RD | 6 | | PECKS CORNER-COHANSEY RD | 6 | | QUAKER NECK RD | 6 | | SPILLWAY DR | 6 | | TELEGRAPH RD | 6 | | ALLOWAYALDINE RD | 4 | | BEAL RD | 4 | | BROADWAY | 4 |
| | | Fire incidents reported |
|---|
| Sreet name | Count |
|---|
| CAMP EDGE RD | 4 | | CAN HOUSE RD | 4 | | COMMISSIONERS PIKE RD | 4 | | EARNEST GARTON RD | 4 | | FRIESBURG RD | 4 | | FRIESBURG-ALDINE RD | 4 | | LAKEVIEW DR | 4 | | MC KILLIP RD | 4 | | PECKS CORNER COHANSEY RD | 4 | | PECKS CORNER RD | 4 | | PLUMMER LANE | 4 | | PLUMMER LANE | 4 | | WATSON MILL RD | 4 | | WELCHVILLE RD | 4 | | WISTAR'S MILL LANE | 4 | | WISTARS MILL LN | 4 | | YORKTOWN RD | 4 | | ALLOWAY FRIESBURG RD | 2 | | ALLOWAY RD | 2 | | ALLOWAY RD | 2 | | ALLOWAY-DARETOWN RD | 2 | | BEAL MILL RD | 2 | | BIRCH ST | 2 | | BRICKYARD RD | 2 | | |
|
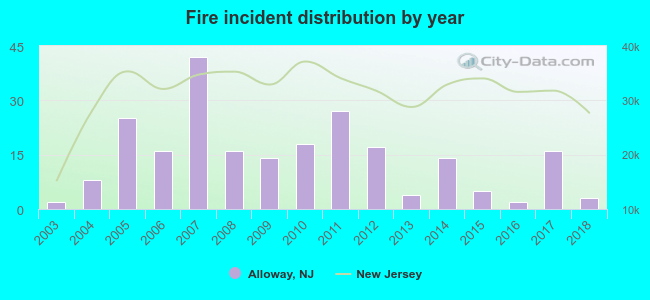 Based on the data from the years 2003 - 2018 the average number of fires per year is 14. The highest number of fires - 42 took place in 2007, and the least - 2 in 2003. The data has a rising trend.
 26.6% incidents where reported in the morning and 73.4% in the evening. The most fires (21.4%) took place on Monday, and the least (5.2%) on Thursday.
 According to the 229 fires from years 2003 - 2018 most fires (16.2%) took place during March, and the least (4.4%) in August.
 Out of all 346 cases reported during the years 2003 - 2018, the most belonged to the categories: Fire (66.2%), Rescue & EMS (21.7%), and Overpressure Rupture (6.1%).
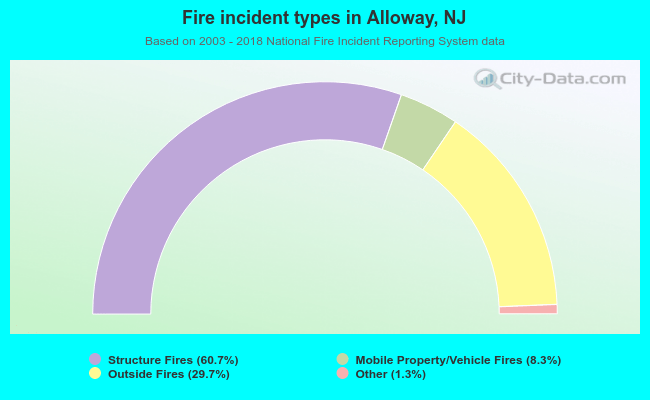 When looking into fire subcategories, the most reports belonged to: Structure Fires (60.7%), and Outside Fires (29.7%).