Altamont: Fire Incidents, Tennessee (TN)
Where are fire incidents reported in Altamont, TN
Something went wrong! Please refresh the page.
|
| |||||||||||||||||||||||||||||||||||||||||||||||||||||||||||||||||||||||||||||||||||||||||||||||||||||||||||||
2004 - 2018 National Fire Incident Reporting System (NFIRS) incidents
- Incident types reported to NFIRS in Altamont, TN
- 44770.4%Fire
- 12720.0%Hazardous Condition
- 243.8%Rescue & EMS
- 121.9%Good Intent Call
- 91.4%Service Call
- 81.3%False Alarm
- 60.9%Special Incident
- 20.3%Severe Weather
- Fire incident types reported to NFIRS in Altamont, TN
- 22750.8%Outside Fires
- 17038.0%Structure Fires
- 286.3%Other
- 224.9%Mobile Property/Vehicle Fires
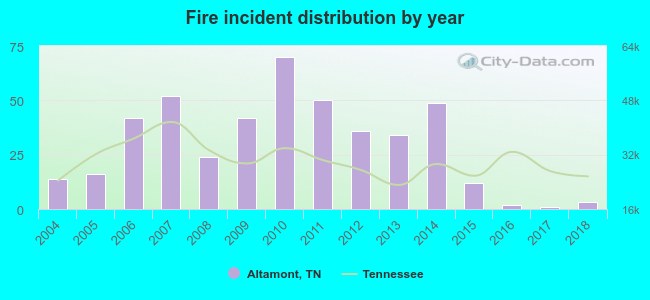 Based on the data from the years 2004 - 2018 the average number of fires per year is 30. The highest number of fire incidents - 70 took place in 2010, and the least - 1 in 2017. The data has a dropping trend.
 According to the data from the years 2004 - 2018 the average number of fire-related yearly deaths is 0. The highest number of deaths - 1 took place in 2011, and the lowest - 0 in 2004. The data has a constant trend.
 36.7% incidents where reported in the morning and 63.3% in the evening. The most fires (16.3%) took place on Saturday, and the least (10.5%) on Tuesday.
 According to the 447 reports from years 2004 - 2018 most fires (19.7%) took place during October, and the least (4.3%) in September.
 Out of all 635 cases reported during the years 2004 - 2018, the most belonged to the categories: Fire (70.4%), Rescue & EMS (20.0%), and Overpressure Rupture (3.8%).
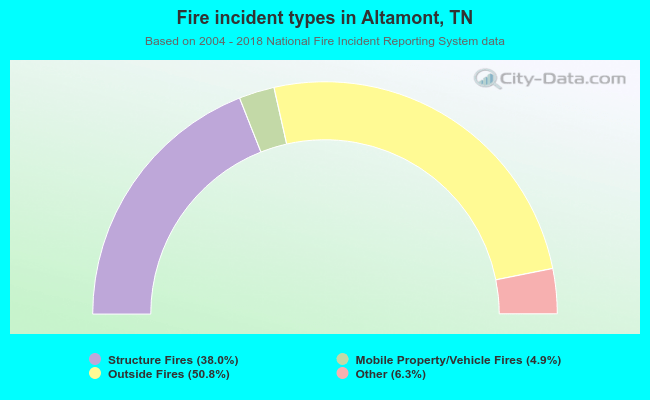 When looking into fire subcategories, the most incidents belonged to: Outside Fires (50.8%), and Structure Fires (38.0%).