Amherst: Fire Incidents, Massachusetts (MA)
Where are fire incidents reported in Amherst, MA
Something went wrong! Please refresh the page.
| Fire incidents reported | |
|---|---|
| Sreet name | Count |
| NORTH PLEASANT ST | 348 |
| HOBART LN | 182 |
| EAST HADLEY RD | 168 |
| MEADOW ST | 134 |
| BELCHERTOWN RD | 124 |
| SOUTH EAST ST | 94 |
| WEST ST | 90 |
| MAIN ST | 88 |
| EAST PLEASANT ST | 84 |
| NORTHAMPTON RD | 54 |
| COLLEGE ST | 52 |
| EASTMAN LN | 46 |
| NORTH PLEASANT STREET | 44 |
| BRANDYWINE DR | 40 |
| MASSACHUSETTS AVE | 38 |
| RIVERGLADE DR | 36 |
| AMITY ST | 34 |
| BAY RD | 34 |
| KELLOGG AVE | 34 |
| SUNSET AVE | 34 |
| NORTH CAMPUS DR | 32 |
| STRONG ST | 32 |
| CLARK HILL RD | 28 |
| NORTH EAST ST | 28 |
| TRIANGLE ST | 28 |
| LINCOLN AVE | 26 |
| MONTAGUE RD | 26 |
| FEARING ST | 24 |
| HENRY ST | 24 |
| LESSEY ST | 24 |
2002 - 2018 National Fire Incident Reporting System (NFIRS) incidents
- Incident types reported to NFIRS in Amherst, MA
- 4,65342.8%False Alarm
- 1,81416.7%Fire
- 1,67015.4%Rescue & EMS
- 1,52514.0%Hazardous Condition
- 6636.1%Good Intent Call
- 4934.5%Service Call
- 260.2%Special Incident
- 240.2%Overpressure Rupture
- Fire incident types reported to NFIRS in Amherst, MA
- 79944.0%Structure Fires
- 76942.4%Outside Fires
- 1437.9%Mobile Property/Vehicle Fires
- 1035.7%Other
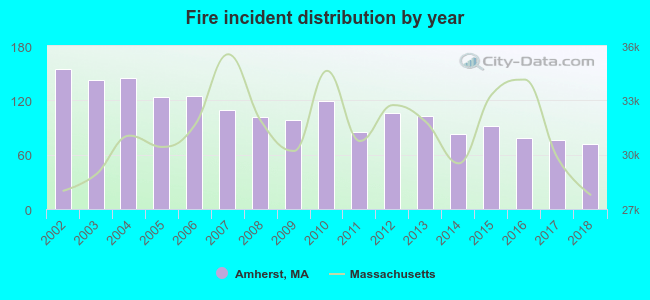 Based on the data from the years 2002 - 2018 the average number of fire incidents per year is 107. The highest number of reported fire incidents - 155 took place in 2002, and the least - 72 in 2018. The data has a declining trend.
The average number of yearly fire incidents per 10k residents in Amherst, MA compared to nearest cities:
(Note: Based on data for the last 3 years, including only cities with population 5,000 and above)
| Amherst: | 19.9 |
| Hadley: | 23.5 |
| Northampton: | 16.5 |
| South Hadley: | 42.3 |
| Easthampton: | 27.6 |
| Deerfield: | 20.2 |
| Holyoke: | 90.1 |
| Montague: | 5.9 |
| Ludlow: | 30.6 |
 The median response time based on all reported fire incidents is 6 minutes. This is higher than the state median value.
The median response time in Amherst, MA compared to nearest cities:
(Note: Based on data for all years, including only cities with at least 500 fire incidents)
| Amherst: | 6 minutes |
| Northampton: | 6 minutes |
| Belchertown: | 10 minutes |
| South Hadley: | 4 minutes |
| Easthampton: | 6 minutes |
| Holyoke: | 4 minutes |
| Ludlow: | 4 minutes |
| Chicopee: | 4 minutes |
| Ware: | 6 minutes |
 According to the reports from the years 2002 - 2018 the average number of fire-related yearly deaths is 0. The highest number of reported deaths - 1 took place in 2002, and the lowest - 0 in 2004. The data has a constant trend.
 Based on the reports from the years 2002 - 2018 the average number of fire-related yearly casualties is 3. The highest number of reported casualties - 13 took place in 2004, and the lowest - 0 in 2014. The data has a decreasing trend.
The average number of injuries per 1,000 fire incidents is 26. This indicator was the highest - 90 in 2004, and the lowest 0 in 2014. The trend for injuries per 1,000 incidents is increasing. Compared to the Massachusetts value the number of injuries per 1,000 fires is much higher.
Based on the reports from the years 2002 - 2018 the average number of fire-related yearly casualties is 3. The highest number of reported casualties - 13 took place in 2004, and the lowest - 0 in 2014. The data has a decreasing trend.
The average number of injuries per 1,000 fire incidents is 26. This indicator was the highest - 90 in 2004, and the lowest 0 in 2014. The trend for injuries per 1,000 incidents is increasing. Compared to the Massachusetts value the number of injuries per 1,000 fires is much higher.Casualties per 1,000 incidents in Amherst, MA compared to nearest cities:
(Note: Based on data for all years, including only cities with at least 500 fire incidents)
| Amherst: | 27.6 |
| Northampton: | 22.1 |
| Belchertown: | 0.0 |
| South Hadley: | 11.2 |
| Easthampton: | 17.3 |
| Holyoke: | 8.8 |
| Ludlow: | 22.3 |
| Chicopee: | 30.2 |
| Ware: | 17.0 |
 36.4% incidents where reported in the morning and 63.6% in the evening. The most fires (17.5%) took place on Saturday, and the least (11.9%) on Wednesday.
 Based on the 1,814 fire incident reports from years 2002 - 2018 most fires (14.5%) took place during May, and the least (5.6%) in January.
 Out of all 10,877 cases reported during the years 2002 - 2018, the most belonged to the categories: False Alarm (42.8%), Fire (16.7%), and Rescue & EMS (15.4%).
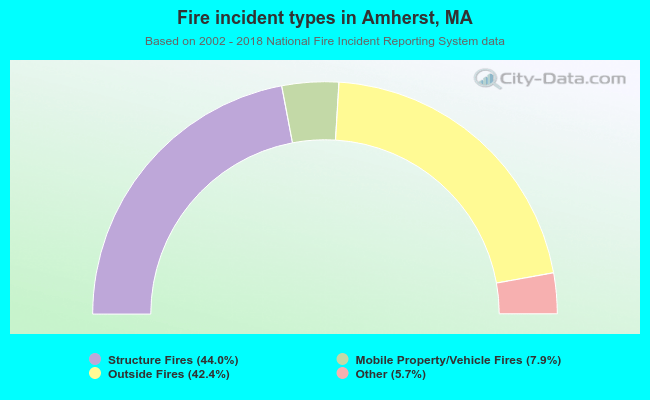 When looking into fire subcategories, the most incidents belonged to: Structure Fires (44.0%), and Outside Fires (42.4%).