Amsterdam: Fire Incidents, New York (NY)
Where are fire incidents reported in Amsterdam, NY
Something went wrong! Please refresh the page.
| Fire incidents reported | |
|---|---|
| Sreet name | Count |
| WALL ST | 110 |
| DIVISION ST | 94 |
| WALL ST | 74 |
| GUY PARK AVE | 72 |
| DIVISION ST | 42 |
| CHURCH ST | 40 |
| ACADEMY ST | 34 |
| E MAIN ST | 34 |
| STATE HWY 30 | 34 |
| GRAND ST | 32 |
| GUY PARK AVE | 32 |
| VROOMAN AVE | 32 |
| CHAPMAN DR | 30 |
| LOCUST AVE | 28 |
| MARKET ST | 26 |
| MARKET ST | 26 |
| PHILLIPS ST | 26 |
| ST HWY 30 | 26 |
| W MAIN ST | 26 |
| SWART HILL RD | 24 |
| CO. HWY 107 | 22 |
| REID ST | 22 |
| ELIZABETH ST | 20 |
| JOHN ST | 20 |
| LINCOLN AVE | 20 |
| MIDLINE RD | 20 |
| EAST MAIN ST | 18 |
| EDSON ST | 18 |
| LOCUST AVE | 18 |
| STATE HIGHWAY 30 | 18 |
| Other | 533 |
2003 - 2018 National Fire Incident Reporting System (NFIRS) incidents
- Incident types reported to NFIRS in Amsterdam, NY
- 10,93559.4%Rescue & EMS
- 2,01510.9%Service Call
- 1,8119.8%Hazardous Condition
- 1,5718.5%Fire
- 1,0435.7%False Alarm
- 9845.3%Good Intent Call
- 270.1%Severe Weather
- Fire incident types reported to NFIRS in Amsterdam, NY
- 96061.1%Structure Fires
- 35722.7%Outside Fires
- 20212.9%Mobile Property/Vehicle Fires
- 523.3%Other
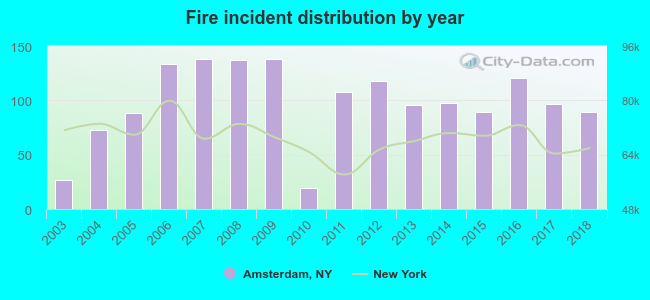 Based on the data from the years 2003 - 2018 the average number of fire incidents per year is 98. The highest number of reported fires - 138 took place in 2007, and the least - 19 in 2010. The data has an increasing trend.
The average number of yearly fire incidents per 10k residents in Amsterdam, NY compared to nearest cities:
(Note: Based on data for the last 3 years, including only cities with population 5,000 and above)
| Amsterdam: | 56.4 |
| Johnstown: | 12.3 |
| Gloversville: | 30.0 |
| Glenville: | 67.6 |
| Scotia: | 26.9 |
| East Glenville: | 1.5 |
| Rotterdam: | 1.0 |
| Schenectady: | 72.1 |
| Ballston Spa: | 17.9 |
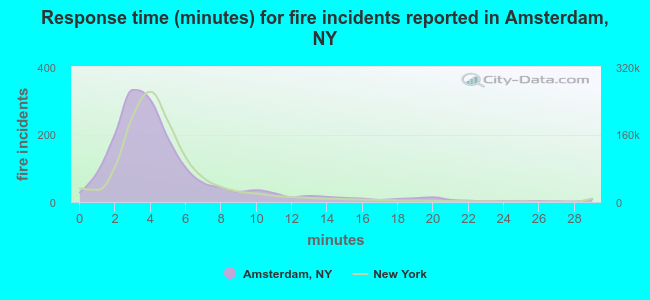 The median response time based on all reported fire incidents is 4 minutes. This is close to the New York median value.
The median response time in Amsterdam, NY compared to nearest cities:
(Note: Based on data for all years, including only cities with at least 500 fire incidents)
| Amsterdam: | 4 minutes |
| Broadalbin: | 6 minutes |
| Johnstown: | 3 minutes |
| Gloversville: | 3 minutes |
| Glenville: | 4 minutes |
| Schenectady: | 4 minutes |
| Niskayuna: | 4 minutes |
| Clifton Park: | 6 minutes |
| Saratoga Springs: | 5 minutes |
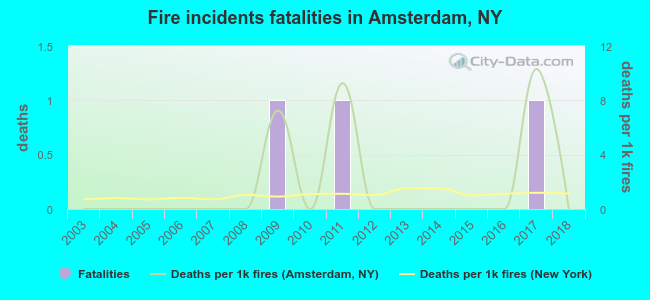 According to the reports from the years 2003 - 2018 the average number of fire-related yearly deaths is 0. The highest number of deaths - 1 took place in 2009, and the lowest - 0 in 2003. The data has a constant trend.
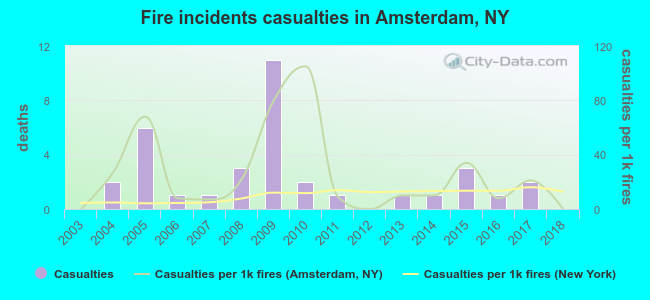 According to the data from the years 2003 - 2018 the average number of fire-related yearly casualties is 2. The highest number of reported injuries - 11 took place in 2009, and the lowest - 0 in 2003. The data has a constant trend.
The average number of injuries per 1,000 fire incidents is 26. This indicator was the highest - 105 in 2010, and the lowest 0 in 2003. The trend for injuries per 1,000 fire incidents is constant. Compared to the New York value the number of casualties per 1,000 fire incidents is much higher.
According to the data from the years 2003 - 2018 the average number of fire-related yearly casualties is 2. The highest number of reported injuries - 11 took place in 2009, and the lowest - 0 in 2003. The data has a constant trend.
The average number of injuries per 1,000 fire incidents is 26. This indicator was the highest - 105 in 2010, and the lowest 0 in 2003. The trend for injuries per 1,000 fire incidents is constant. Compared to the New York value the number of casualties per 1,000 fire incidents is much higher.Casualties per 1,000 incidents in Amsterdam, NY compared to nearest cities:
(Note: Based on data for all years, including only cities with at least 500 fire incidents)
| Amsterdam: | 22.3 |
| Broadalbin: | 0.0 |
| Johnstown: | 16.4 |
| Gloversville: | 31.4 |
| Glenville: | 2.2 |
| Schenectady: | 11.2 |
| Niskayuna: | 13.8 |
| Clifton Park: | 6.7 |
| Saratoga Springs: | 13.0 |
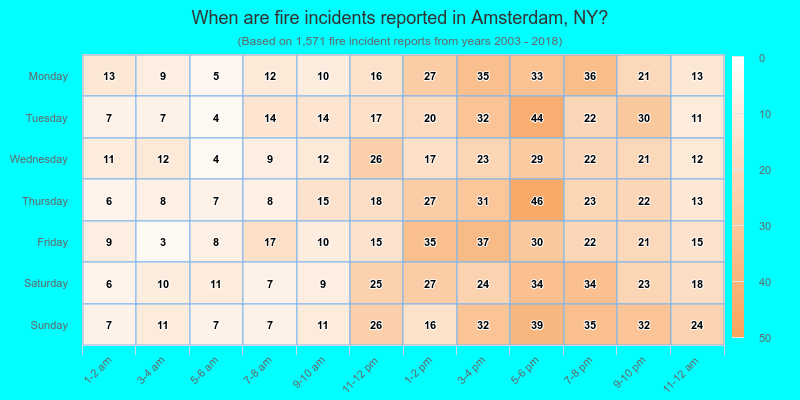
 29.5% incidents where reported in the morning and 70.5% in the evening. The most fires (15.7%) took place on Sunday, and the least (12.6%) on Wednesday.
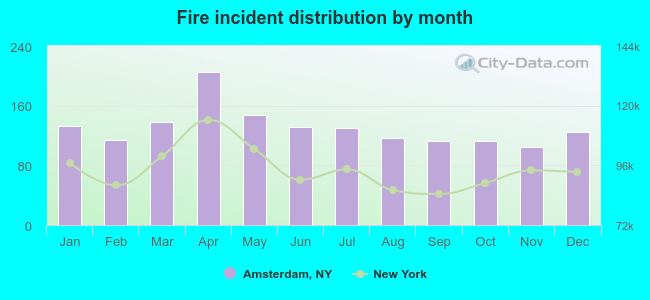 According to the 1,571 fire incident reports from years 2003 - 2018 most fires (13.0%) took place during April, and the least (6.6%) in November.
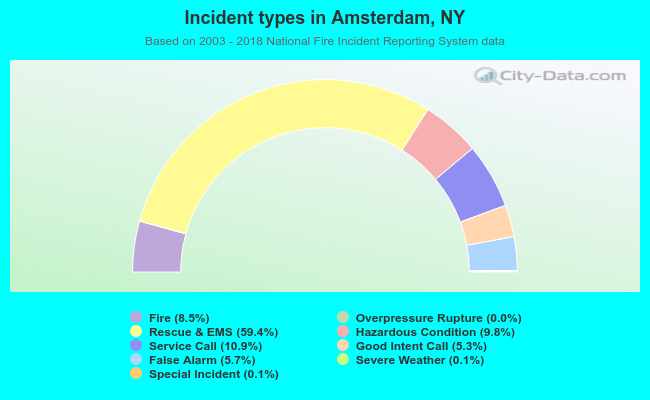 Out of all 18,405 cases reported during the years 2003 - 2018, the most belonged to the categories: Rescue & EMS (59.4%), Service Call (10.9%), and Hazardous Condition (9.8%).
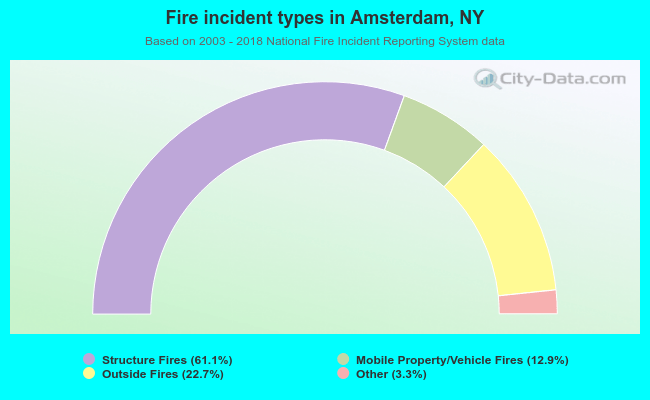 When looking into fire subcategories, the most incidents belonged to: Structure Fires (61.1%), and Outside Fires (22.7%).