Anderson: Fire Incidents, Indiana (IN)
Where are fire incidents reported in Anderson, IN
Something went wrong! Please refresh the page.
| Fire incidents reported | |
|---|---|
| Sreet name | Count |
| 500 | 74 |
| 300 | 66 |
| 53RD ST | 58 |
| SCATTERFIELD RD | 58 |
| 12TH ST | 50 |
| 300 N. | 48 |
| 200 | 44 |
| ALEXANDRIA PIKE | 44 |
| MADISON AV | 40 |
| 100 | 36 |
| 600 | 36 |
| CR 600 CR | 34 |
| MAIN ST | 34 |
| 8 TH STEET RD | 32 |
| COLUMBUS AV | 32 |
| STATE RD. 9 | 32 |
| 200 N. | 30 |
| 360 | 28 |
| 8TH ST | 28 |
| 9TH ST | 28 |
| JACKSON ST | 28 |
| STATE ROAD 9 | 26 |
| 11TH ST | 24 |
| 16TH ST | 24 |
| NICHOL AV | 24 |
| ST. RD. 9 | 24 |
| 300 N | 22 |
| 350 | 22 |
| BROWN ST | 22 |
| CR 100 CR | 22 |
| Other | 914 |
2002 - 2017 National Fire Incident Reporting System (NFIRS) incidents
- Incident types reported to NFIRS in Anderson, IN
- 7,75466.5%Rescue & EMS
- 1,98417.0%Fire
- 6845.9%Hazardous Condition
- 5754.9%Good Intent Call
- 4163.6%Service Call
- 1881.6%False Alarm
- 220.2%Severe Weather
- 200.2%Overpressure Rupture
- Fire incident types reported to NFIRS in Anderson, IN
- 63732.1%Structure Fires
- 62331.4%Other
- 60730.6%Outside Fires
- 1175.9%Mobile Property/Vehicle Fires
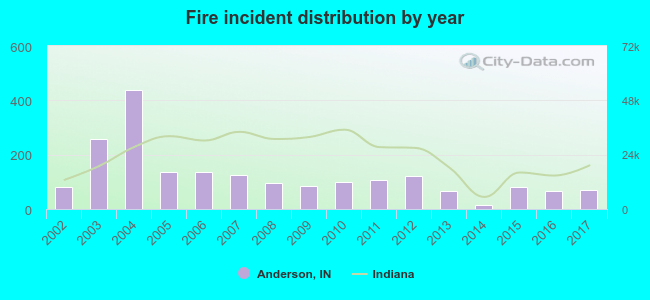 According to the data from the years 2002 - 2017 the average number of fire incidents per year is 124. The highest number of fires - 439 took place in 2004, and the least - 14 in 2014. The data has a dropping trend.
The average number of yearly fire incidents per 10k residents in Anderson, IN compared to nearest cities:
(Note: Based on data for the last 3 years, including only cities with population 5,000 and above)
| Anderson: | 8.4 |
| Alexandria: | 16.4 |
| Yorktown: | 45.2 |
| Elwood: | 24.8 |
| Muncie: | 25.5 |
| Noblesville: | 17.4 |
| McCordsville: | 29.4 |
| Fishers: | 4.8 |
| New Castle: | 30.4 |
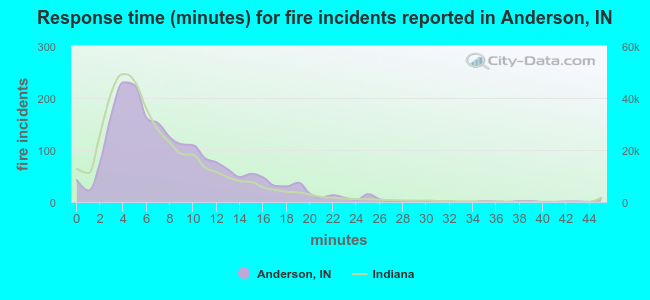 The median response time based on all reported fire incidents is 7 minutes. This is close to the state median value.
The median response time in Anderson, IN compared to nearest cities:
(Note: Based on data for all years, including only cities with at least 500 fire incidents)
| Anderson: | 7 minutes |
| Chesterfield: | 8 minutes |
| Daleville: | 8 minutes |
| Pendleton: | 8 minutes |
| Middletown: | 6 minutes |
| Alexandria: | 5 minutes |
| Yorktown: | 9 minutes |
| Elwood: | 3 minutes |
| Muncie: | 5 minutes |
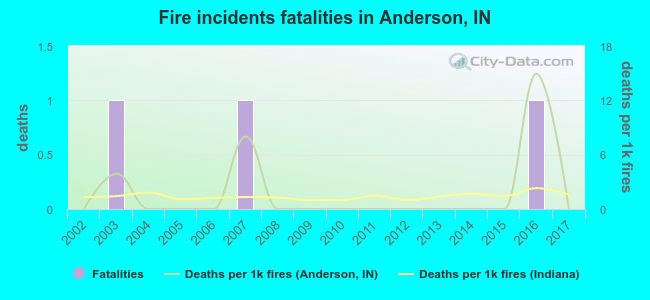 Based on the reports from the years 2002 - 2017 the average number of fire-related yearly deaths is 0. The highest number of deaths - 1 took place in 2003, and the lowest - 0 in 2002. The data has a constant trend.
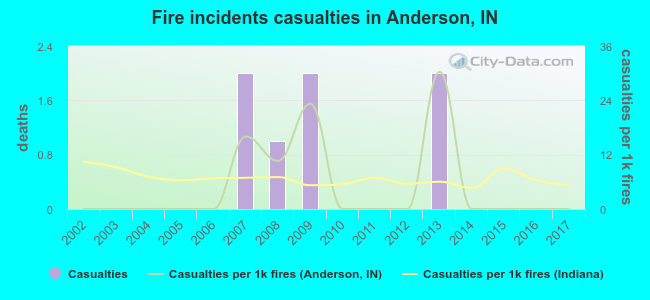 Based on the data from the years 2002 - 2017 the average number of fire-related casualties per year is 0. The highest number of reported injuries - 2 took place in 2007, and the lowest - 0 in 2002. The data has a constant trend.
The average number of injuries per 1,000 fires is 5. This indicator was the highest - 30 in 2013, and the lowest 0 in 2002. The trend for casualties per 1,000 incidents is constant. Compared to the Indiana value the number of injuries per 1,000 fires is lower.
Based on the data from the years 2002 - 2017 the average number of fire-related casualties per year is 0. The highest number of reported injuries - 2 took place in 2007, and the lowest - 0 in 2002. The data has a constant trend.
The average number of injuries per 1,000 fires is 5. This indicator was the highest - 30 in 2013, and the lowest 0 in 2002. The trend for casualties per 1,000 incidents is constant. Compared to the Indiana value the number of injuries per 1,000 fires is lower.Casualties per 1,000 incidents in Anderson, IN compared to nearest cities:
(Note: Based on data for all years, including only cities with at least 500 fire incidents)
| Anderson: | 3.5 |
| Chesterfield: | 5.6 |
| Daleville: | 21.3 |
| Pendleton: | 1.7 |
| Middletown: | 1.9 |
| Alexandria: | 25.3 |
| Yorktown: | 2.1 |
| Elwood: | 6.6 |
| Muncie: | 13.0 |
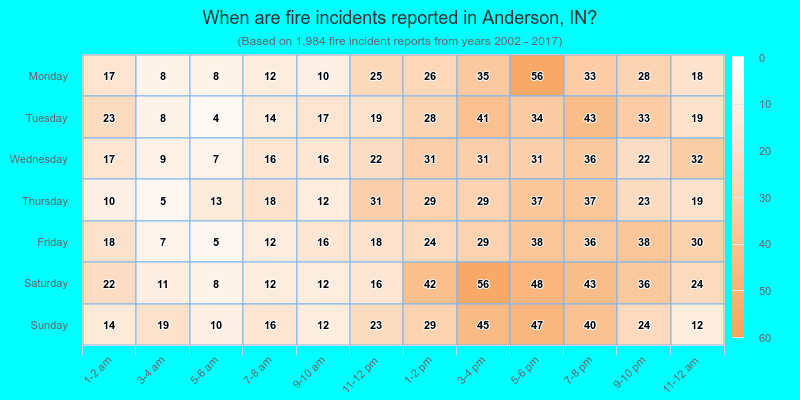
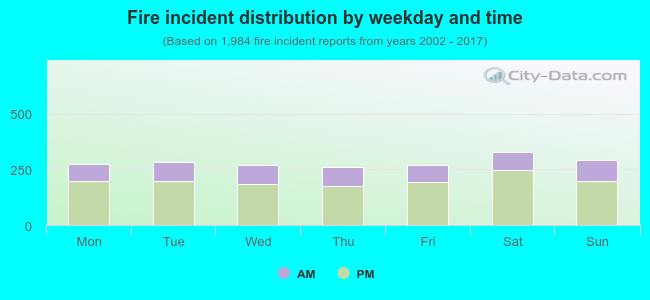 29.8% incidents where reported in the morning and 70.2% in the evening. The most fires (16.6%) took place on Saturday, and the least (13.3%) on Thursday.
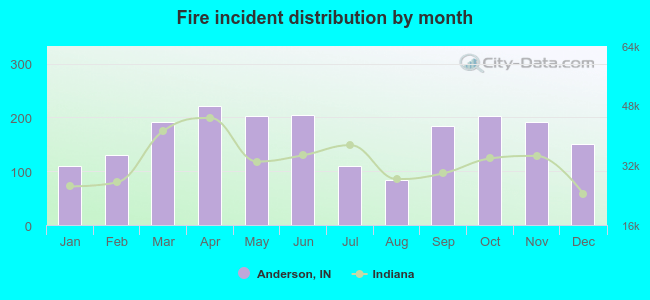 Based on the 1,984 fire incidents from years 2002 - 2017 most fires (11.2%) took place during April, and the least (4.2%) in August.
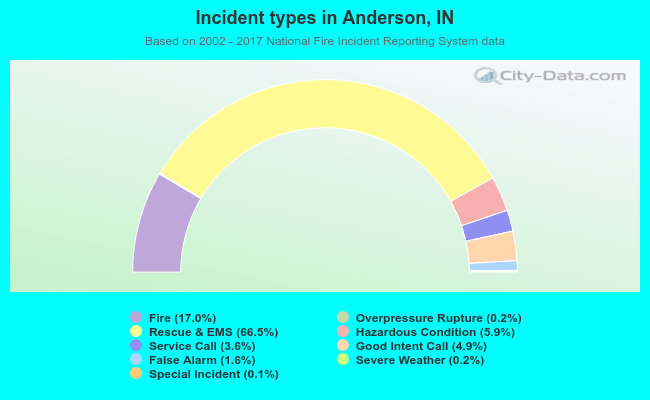 Out of all 11,652 cases reported during the years 2002 - 2017, the most belonged to the categories: Rescue & EMS (66.5%), Fire (17.0%), and Hazardous Condition (5.9%).
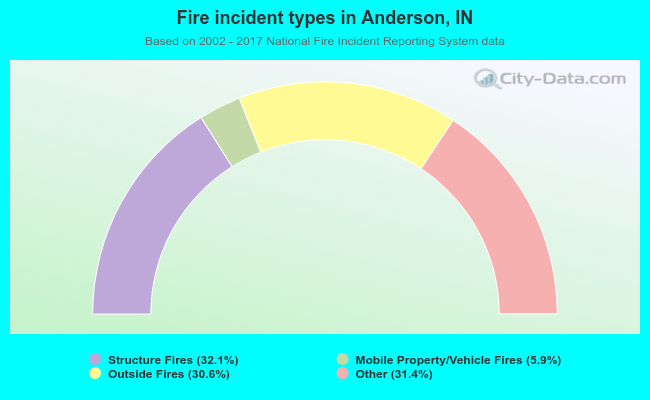 When looking into fire subcategories, the most reports belonged to: Structure Fires (32.1%), and Other (31.4%).