Andover: Fire Incidents, Massachusetts (MA)
Where are fire incidents reported in Andover, MA
Something went wrong! Please refresh the page.
| Fire incidents reported | |
|---|---|
| Sreet name | Count |
| NO MAIN ST | 142 |
| MAIN ST | 130 |
| RIVER RD | 128 |
| LOWELL ST | 94 |
| ANDOVER ST | 76 |
| RT 93 NO RT 125/RT 1 | 72 |
| CHAPEL AV | 66 |
| BARTLET ST | 64 |
| RT 93 NO RT 133/METH | 56 |
| RT 93 SO DASCOMB/RT | 52 |
| SO MAIN ST | 52 |
| SALEM ST | 50 |
| BULLFINCH DR | 44 |
| DASCOMB RD | 44 |
| SHAWSHEEN RD | 44 |
| COLONIAL DR | 40 |
| GRANDVIEW TR | 40 |
| HAVERHILL ST | 40 |
| LOWELL JC RD | 40 |
| RAILROAD ST | 40 |
| RT 495 SO AT RT 93 | 38 |
| SCHOOL ST | 38 |
| ELM ST | 36 |
| MORTON ST | 36 |
| MURRAY WY | 36 |
| RT 93 SO METHEUN/DAS | 36 |
| ABBOTT ST | 32 |
| GREAT QUAD RD | 32 |
| HIGH ST | 32 |
| RT 495 NO/RT 93 | 32 |
| Other | 308 |
2002 - 2018 National Fire Incident Reporting System (NFIRS) incidents
- Incident types reported to NFIRS in Andover, MA
- 5,20228.1%Rescue & EMS
- 4,24022.9%False Alarm
- 3,44518.6%Hazardous Condition
- 1,97010.6%Fire
- 1,92010.4%Service Call
- 1,0175.5%Special Incident
- 6843.7%Good Intent Call
- 270.1%Overpressure Rupture
- Fire incident types reported to NFIRS in Andover, MA
- 87044.2%Structure Fires
- 54527.7%Outside Fires
- 36318.4%Mobile Property/Vehicle Fires
- 1929.7%Other
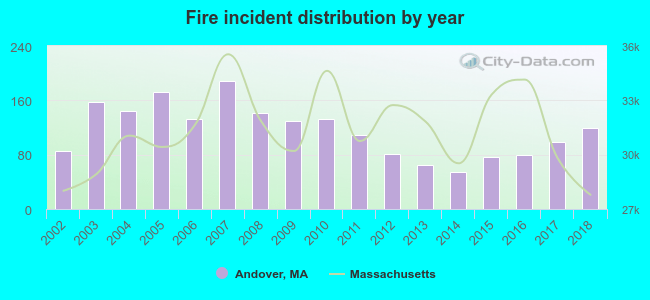 Based on the data from the years 2002 - 2018 the average number of fire incidents per year is 116. The highest number of reported fire incidents - 188 took place in 2007, and the least - 54 in 2014. The data has a rising trend.
The average number of yearly fire incidents per 10k residents in Andover, MA compared to nearest cities:
(Note: Based on data for the last 3 years, including only cities with population 5,000 and above)
| Andover: | 113.4 |
| North Andover: | 38.9 |
| Lawrence: | 26.0 |
| Methuen: | 26.7 |
| North Reading: | 24.2 |
| Tewksbury: | 29.8 |
| Wilmington: | 23.6 |
| Middleton: | 34.9 |
| Groveland: | 32.5 |
 The median response time based on all reported fire incidents is 6 minutes. This is higher than the state median value.
The median response time in Andover, MA compared to nearest cities:
(Note: Based on data for all years, including only cities with at least 500 fire incidents)
| Andover: | 6 minutes |
| North Andover: | 4 minutes |
| Lawrence: | 3 minutes |
| Methuen: | 4 minutes |
| North Reading: | 4 minutes |
| Tewksbury: | 4 minutes |
| Wilmington: | 6 minutes |
| Middleton: | 4 minutes |
| Boxford: | 8 minutes |
 28.8% incidents where reported in the morning and 71.2% in the evening. The most fires (15.1%) took place on Friday, and the least (13.6%) on Tuesday.
 According to the 1,970 reports from years 2002 - 2018 most fires (11.1%) took place during April, and the least (6.4%) in October.
 Out of all 18,523 cases reported during the years 2002 - 2018, the most belonged to the categories: Rescue & EMS (28.1%), False Alarm (22.9%), and Hazardous Condition (18.6%).
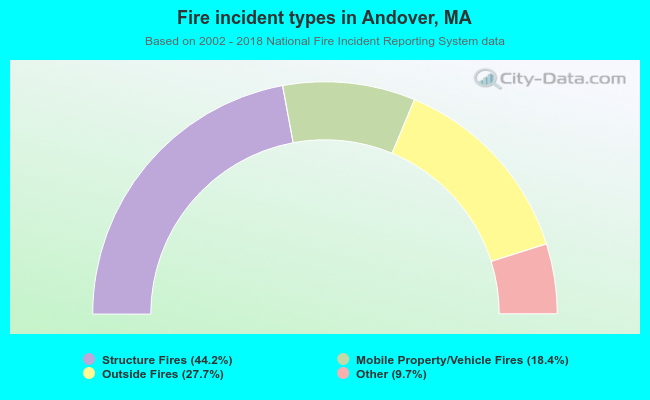 When looking into fire subcategories, the most reports belonged to: Structure Fires (44.2%), and Outside Fires (27.7%).