Arbutus: Fire Incidents, Maryland (MD)
Where are fire incidents reported in Arbutus, MD
Something went wrong! Please refresh the page.
|
| |||||||||||||||||||||||||||||||||||||||||||||||||||||||||||||||||||||||||||||||||||||||||||||||||||||||||||||
2004 - 2018 National Fire Incident Reporting System (NFIRS) incidents
- Incident types reported to NFIRS in Arbutus, MD
- 6,48767.2%Rescue & EMS
- 1,21312.6%Hazardous Condition
- 6877.1%Fire
- 5445.6%Good Intent Call
- 3783.9%Service Call
- 3123.2%False Alarm
- 180.2%Special Incident
- 160.2%Overpressure Rupture
- Fire incident types reported to NFIRS in Arbutus, MD
- 35351.4%Outside Fires
- 18426.8%Mobile Property/Vehicle Fires
- 7911.5%Structure Fires
- 7110.3%Other
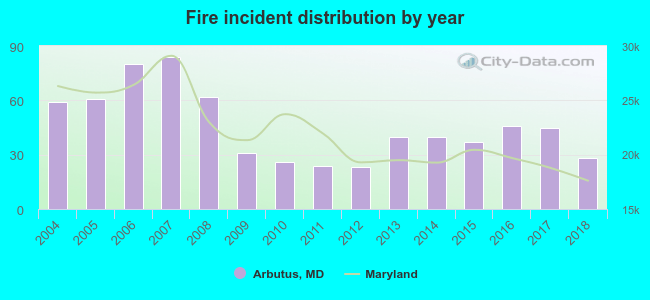 Based on the data from the years 2004 - 2018 the average number of fires per year is 46. The highest number of fire incidents - 84 took place in 2007, and the least - 23 in 2012. The data has a dropping trend.
The average number of yearly fire incidents per 10k residents in Arbutus, MD compared to nearest cities:
(Note: Based on data for the last 3 years, including only cities with population 5,000 and above)
| Arbutus: | 19.4 |
| Lansdowne: | 2.4 |
| Catonsville: | 21.1 |
| Linthicum: | 31.6 |
| Elkridge: | 60.5 |
| Brooklyn Park: | 5.3 |
| Ferndale: | 1.6 |
| Baltimore: | 47.1 |
| Glen Burnie: | 36.9 |
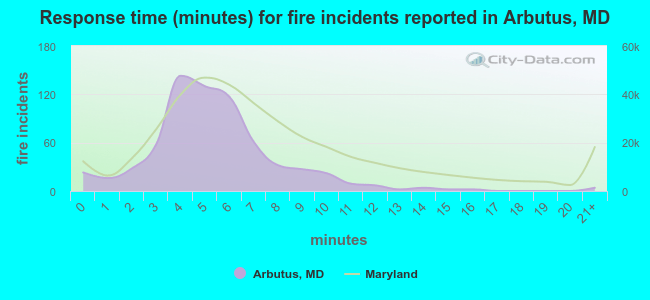 The median response time based on all reported fire incidents is 5 minutes. This is lower than the state median value.
The median response time in Arbutus, MD compared to nearest cities:
(Note: Based on data for all years, including only cities with at least 500 fire incidents)
| Arbutus: | 5 minutes |
| Catonsville: | 5 minutes |
| Elkridge: | 7 minutes |
| Baltimore: | 6 minutes |
| Glen Burnie: | 6 minutes |
| Ellicott City: | 7 minutes |
| Severn: | 7 minutes |
| Jessup: | 7 minutes |
| Columbia: | 6 minutes |
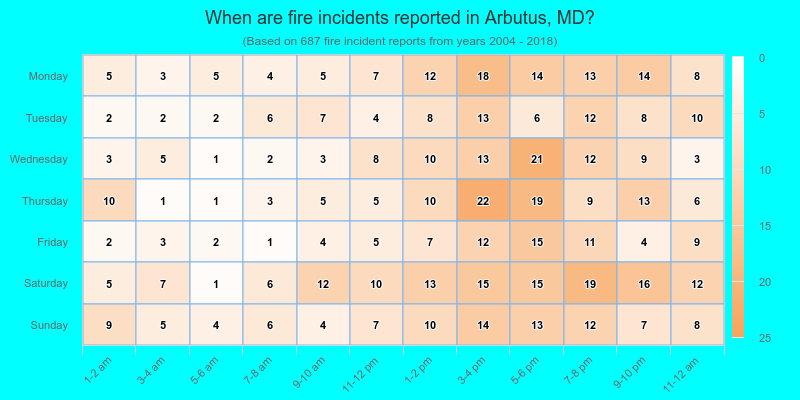
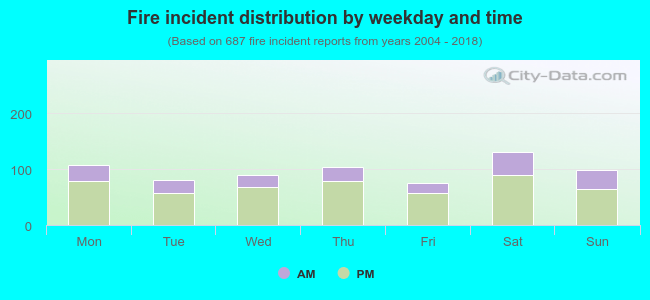 27.9% incidents where reported in the morning and 72.1% in the evening. The most fires (19.1%) took place on Saturday, and the least (10.9%) on Friday.
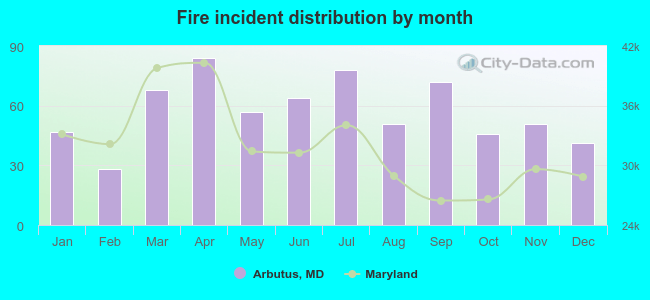 Based on the 687 reports from years 2004 - 2018 most fires (12.2%) took place during April, and the least (4.1%) in February.
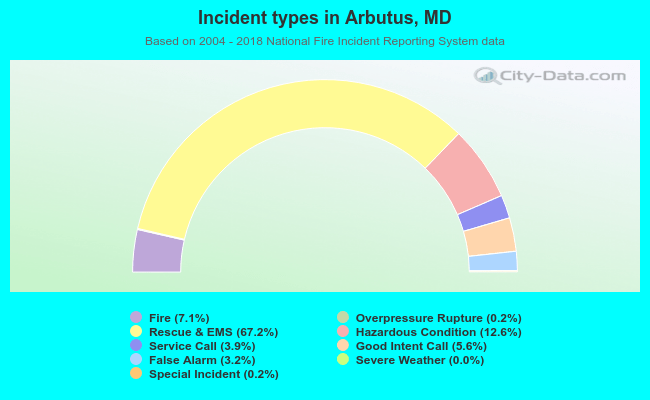 Out of all 9,656 cases reported during the years 2004 - 2018, the most belonged to the categories: Rescue & EMS (67.2%), Hazardous Condition (12.6%), and Fire (7.1%).
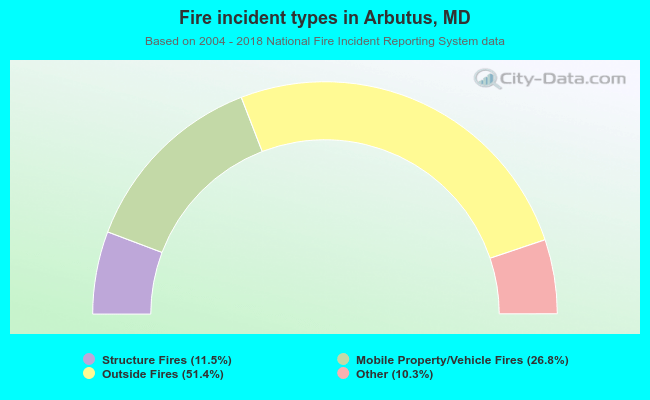 When looking into fire subcategories, the most reports belonged to: Outside Fires (51.4%), and Mobile Property/Vehicle Fires (26.8%).