| Fire incidents reported |
|---|
| Sreet name | Count |
|---|
| INTERSTATE 84 FWY | 26 | | MAIN ST | 20 | | SHANE DR | 20 | | CHERRY ST | 14 | | 1ST ST | 12 | | DAHLIA ST | 12 | | HERITAGE LN | 10 | | BEECH ST | 8 | | HIGHWAY 19 | 8 | | HWY 74 HWY | 8 | | UPPER ROCK CREEK RD | 8 | | 19 HWY | 6 | | 2ND ST | 6 | | BARNETT RD | 6 | | EIGHT MILE RD | 6 | | HWY 19 | 6 | | HWY 19 HWY | 6 | | HWY 74 | 6 | | I 84 MP 136 | 6 | | I 84 MP 149 | 6 | | I 84 MP 150 | 6 | | I 84 MP 151 | 6 | | INTERSTATE 84 | 6 | | MIKKALO LN | 6 | | SCOTT CANYON LN | 6 |
| | | Fire incidents reported |
|---|
| Sreet name | Count |
|---|
| UNREPORTED | 6 | | 206 HWY | 4 | | 74 HWY | 4 | | 8 MILE CANYON RD | 4 | | 8 MILE RD | 4 | | BERTHOLD RD | 4 | | BLALOCK CANYON RD | 4 | | CEDAR SPRINGS LN | 4 | | CHILDERS RD | 4 | | I 84 MP 123 | 4 | | I 84 MP 128 | 4 | | I 84 MP 129 | 4 | | I 84 MP 132 | 4 | | I 84 MP 139 | 4 | | I 84 MP 147 | 4 | | I 84 MP 148 | 4 | | I84 | 4 | | I84 FWY | 4 | | INTERSTATE 84 AT RR TRACKS | 4 | | INTERSTATE 84 AT VIEWPOINT HWY | 4 | | INTERSTATE 84 FWAY | 4 | | INTERSTATE 84 MP 147 | 4 | | LOWER ROCK CREEK RD | 4 | | MAIN ST | 4 | | |
|
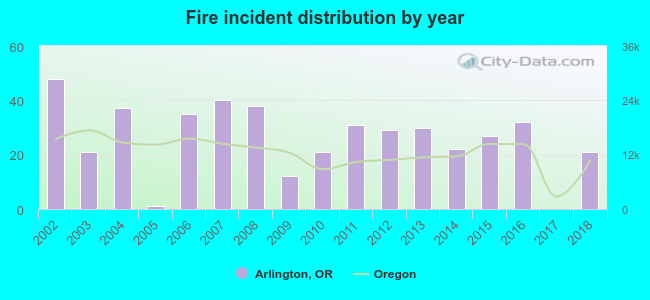 According to the data from the years 2002 - 2018 the average number of fires per year is 26. The highest number of reported fires - 48 took place in 2002, and the least - 0 in 2017. The data has a declining trend.
 29.2% incidents where reported in the morning and 70.8% in the evening. The most fires (17.1%) took place on Monday, and the least (12.8%) on Friday.
 According to the 445 fire incidents from years 2002 - 2018 most fires (24.0%) took place during July, and the least (1.6%) in December.
 Out of all 594 cases reported during the years 2002 - 2018, the most belonged to the categories: Fire (74.9%), Rescue & EMS (13.0%), and Service Call (8.6%).
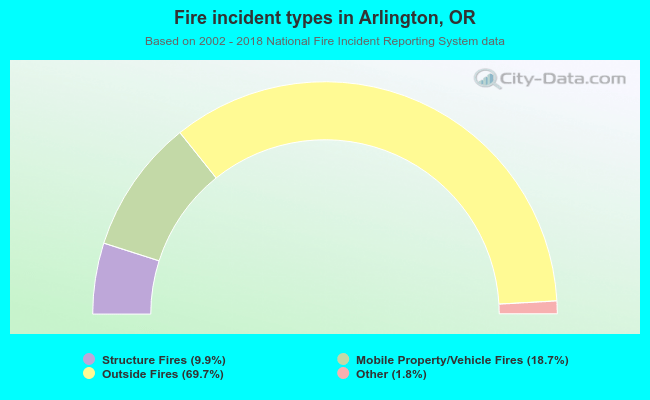 When looking into fire subcategories, the most incidents belonged to: Outside Fires (69.7%), and Mobile Property/Vehicle Fires (18.7%).