Arnold: Fire Incidents, Maryland (MD)
Where are fire incidents reported in Arnold, MD
Something went wrong! Please refresh the page.
|
| |||||||||||||||||||||||||||||||||||||||||||||||||||||||||||||||||||||||||||||||||||||||||||||||||||||||||||||
2008 - 2018 National Fire Incident Reporting System (NFIRS) incidents
- Incident types reported to NFIRS in Arnold, MD
- 4,29161.8%Rescue & EMS
- 90313.0%Good Intent Call
- 6659.6%Hazardous Condition
- 4206.0%Service Call
- 3575.1%Fire
- 2804.0%False Alarm
- 130.2%Overpressure Rupture
- 80.1%Special Incident
- Fire incident types reported to NFIRS in Arnold, MD
- 20858.3%Structure Fires
- 10128.3%Outside Fires
- 4011.2%Mobile Property/Vehicle Fires
- 82.2%Other
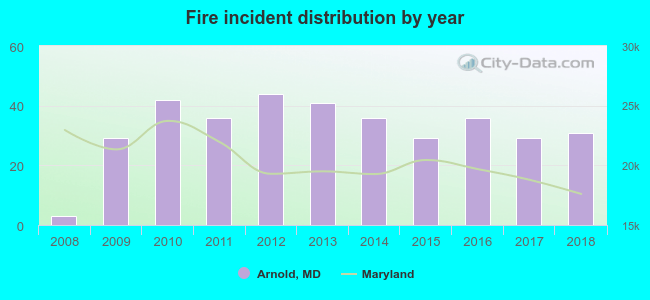 Based on the data from the years 2008 - 2018 the average number of fires per year is 32. The highest number of fire incidents - 44 took place in 2012, and the least - 3 in 2008. The data has a growing trend.
The average number of yearly fire incidents per 10k residents in Arnold, MD compared to nearest cities:
(Note: Based on data for the last 3 years, including only cities with population 5,000 and above)
| Arnold: | 13.8 |
| Lake Shore: | 0.5 |
| Severna Park: | 10.5 |
| Annapolis: | 64.3 |
| Pasadena: | 36.1 |
| Edgewater: | 45.4 |
| Glen Burnie: | 36.9 |
| Crofton: | 14.3 |
| Stevensville: | 77.9 |
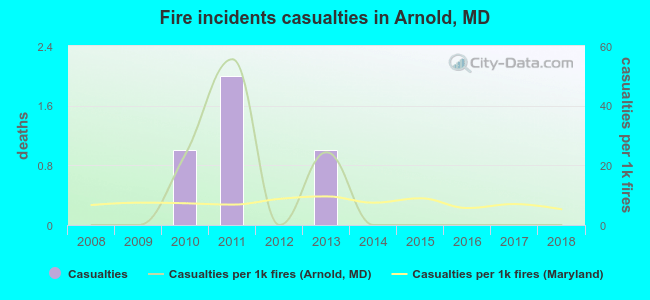 According to the data from the years 2008 - 2018 the average number of fire-related casualties per year is 0. The highest number of casualties - 2 took place in 2011, and the lowest - 0 in 2008. The data has a constant trend.
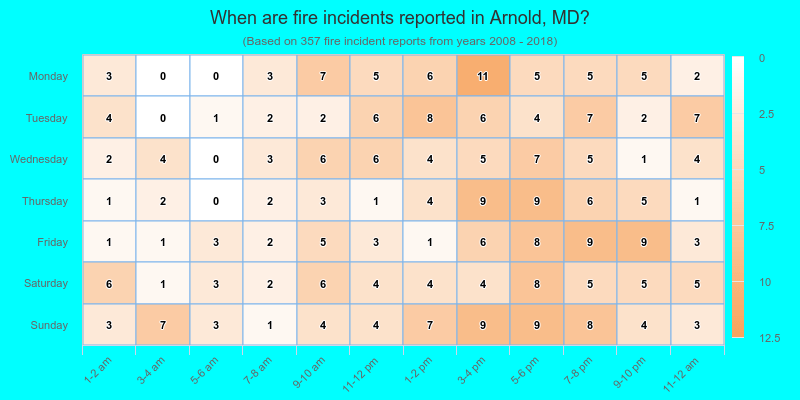
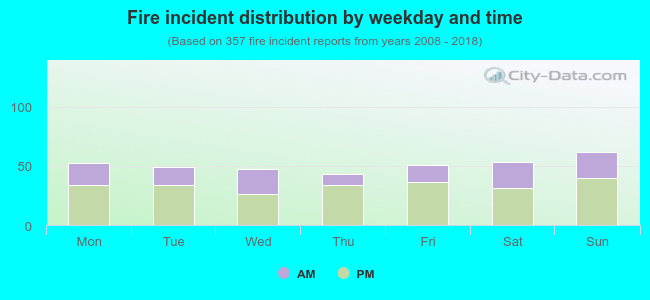 34.2% incidents where reported in the morning and 65.8% in the evening. The most fires (17.4%) took place on Sunday, and the least (12.0%) on Thursday.
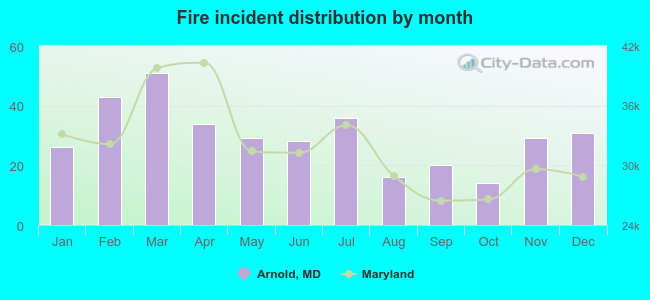 Based on the 357 fire incidents from years 2008 - 2018 most fires (14.3%) took place during March, and the least (3.9%) in October.
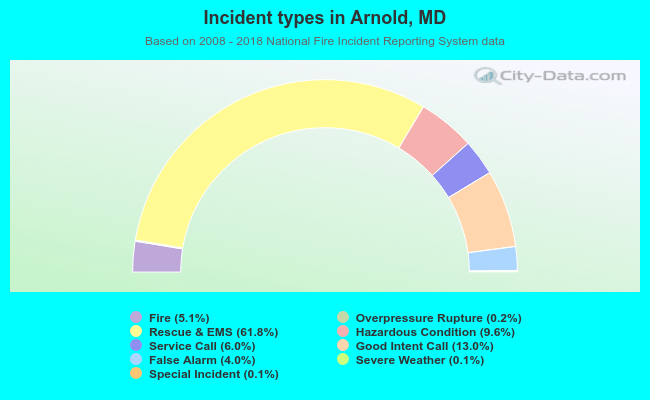 Out of all 6,943 cases reported during the years 2008 - 2018, the most belonged to the categories: Rescue & EMS (61.8%), Good Intent Call (13.0%), and Hazardous Condition (9.6%).
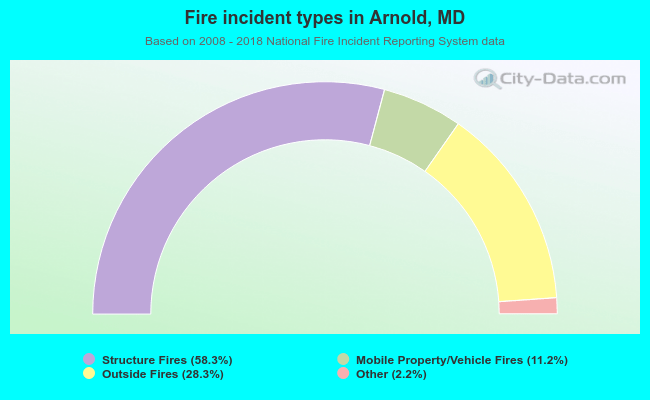 When looking into fire subcategories, the most reports belonged to: Structure Fires (58.3%), and Outside Fires (28.3%).