Ashwaubenon: Fire Incidents, Wisconsin (WI)
Where are fire incidents reported in Ashwaubenon, WI
Something went wrong! Please refresh the page.
|
| |||||||||||||||||||||||||||||||||||||||||||||||||||||||||||||||||||||||||||||||||||||||||||||||||||||||||||||
2003 - 2018 National Fire Incident Reporting System (NFIRS) incidents
- Incident types reported to NFIRS in Ashwaubenon, WI
- 39929.8%Fire
- 36127.0%Rescue & EMS
- 29622.1%Hazardous Condition
- 18613.9%Good Intent Call
- 594.4%False Alarm
- 261.9%Service Call
- 60.4%Overpressure Rupture
- 50.4%Special Incident
- Fire incident types reported to NFIRS in Ashwaubenon, WI
- 15939.8%Structure Fires
- 10726.8%Mobile Property/Vehicle Fires
- 10225.6%Outside Fires
- 317.8%Other
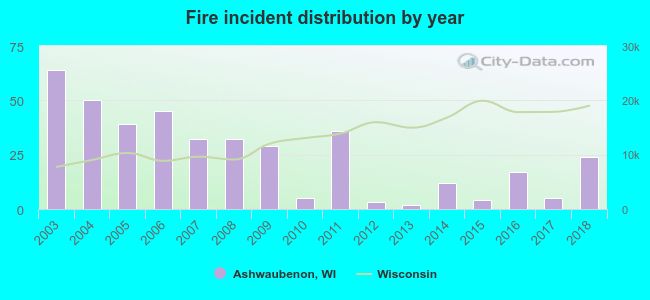 Based on the data from the years 2003 - 2018 the average number of fire incidents per year is 25. The highest number of reported fires - 64 took place in 2003, and the least - 2 in 2013. The data has a declining trend.
The average number of yearly fire incidents per 10k residents in Ashwaubenon, WI compared to nearest cities:
(Note: Based on data for the last 3 years, including only cities with population 5,000 and above)
| Ashwaubenon: | 9.0 |
| Allouez: | 0.7 |
| De Pere: | 19.3 |
| Hobart: | 5.1 |
| Green Bay: | 22.1 |
| Howard: | 11.4 |
| Bellevue: | 27.8 |
| Ledgeview: | 4.6 |
| Suamico: | 9.5 |
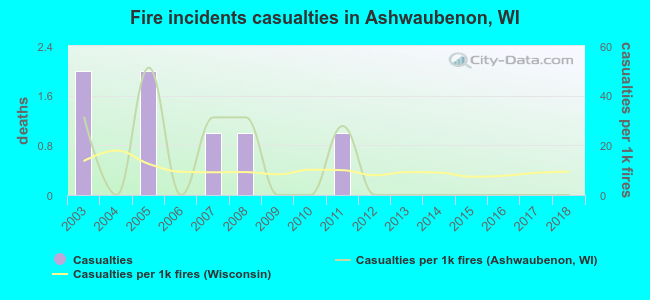 According to the data from the years 2003 - 2018 the average number of fire-related yearly casualties is 0. The highest number of reported casualties - 2 took place in 2003, and the lowest - 0 in 2004. The data has a decreasing trend.
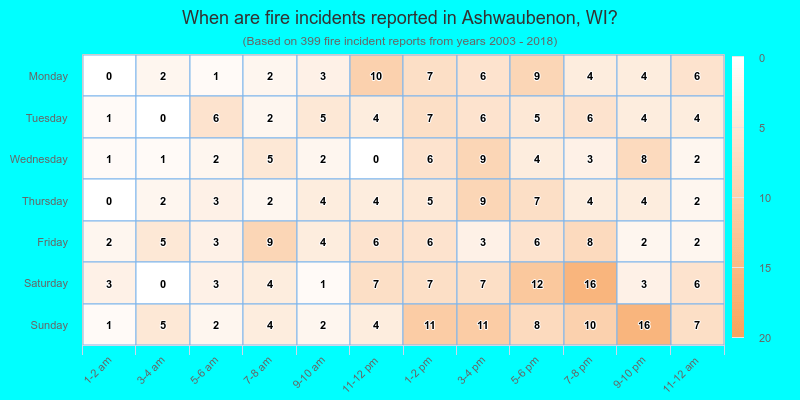
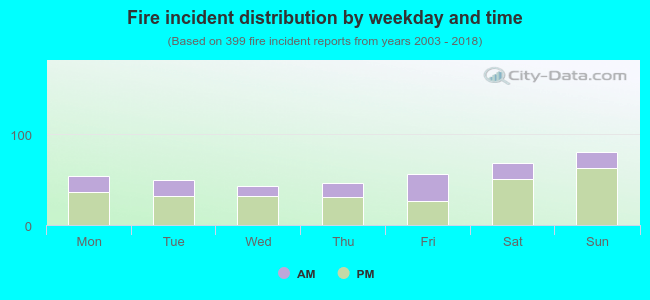 31.8% incidents where reported in the morning and 68.2% in the evening. The most fires (20.3%) took place on Sunday, and the least (10.8%) on Wednesday.
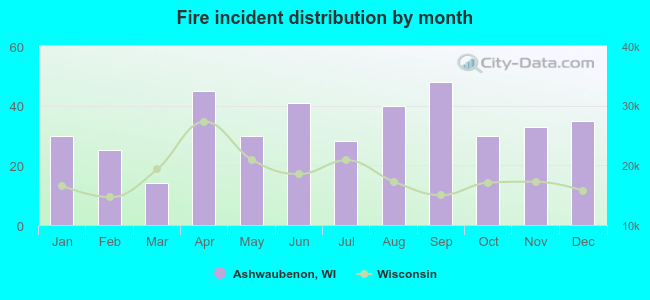 According to the 399 fire incidents from years 2003 - 2018 most fires (12.0%) took place during September, and the least (3.5%) in March.
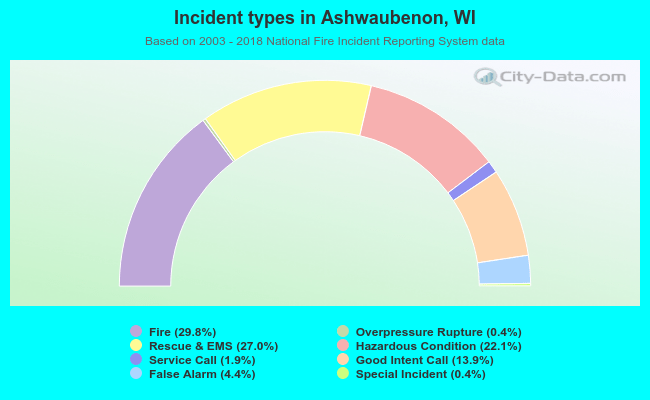 Out of all 1,338 cases reported during the years 2003 - 2018, the most belonged to the categories: Fire (29.8%), Rescue & EMS (27.0%), and Hazardous Condition (22.1%).
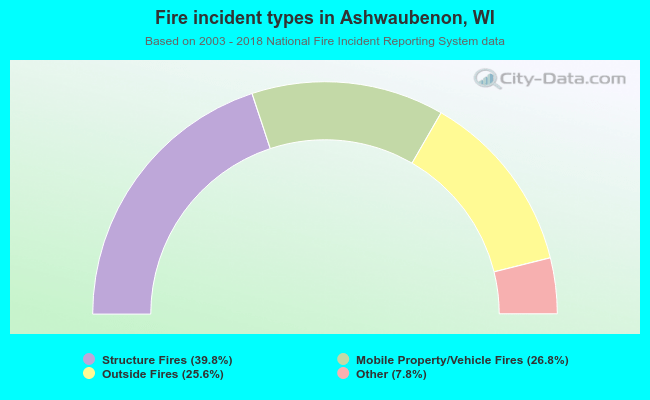 When looking into fire subcategories, the most reports belonged to: Structure Fires (39.8%), and Mobile Property/Vehicle Fires (26.8%).