Auburn: Fire Incidents, Michigan (MI)
Where are fire incidents reported in Auburn, MI
Something went wrong! Please refresh the page.
|
| |||||||||||||||||||||||||||||||||||||||||||||||||||||||||||||||||||||||||||||||||||||||||||||||||||||||||||||
2002 - 2018 National Fire Incident Reporting System (NFIRS) incidents
- Incident types reported to NFIRS in Auburn, MI
- 1,91664.9%Rescue & EMS
- 33411.3%Hazardous Condition
- 2889.8%Fire
- 2659.0%Good Intent Call
- 1063.6%Service Call
- 401.4%False Alarm
- Fire incident types reported to NFIRS in Auburn, MI
- 12242.4%Structure Fires
- 8529.5%Mobile Property/Vehicle Fires
- 7225.0%Outside Fires
- 93.1%Other
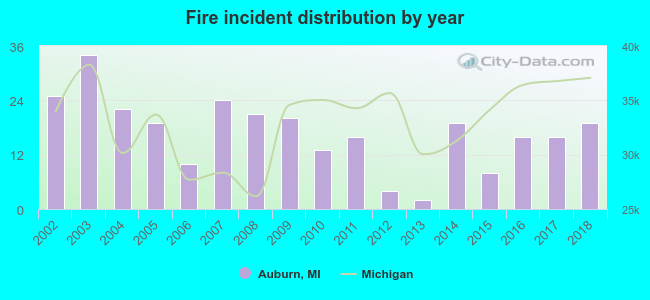 Based on the data from the years 2002 - 2018 the average number of fire incidents per year is 17. The highest number of reported fires - 34 took place in 2003, and the least - 2 in 2013. The data has a declining trend.
 According to the data from the years 2002 - 2018 the average number of fire-related yearly casualties is 0. The highest number of reported casualties - 2 took place in 2002, and the lowest - 0 in 2003. The data has a dropping trend.
 31.9% incidents where reported in the morning and 68.1% in the evening. The most fires (16.3%) took place on Saturday, and the least (12.8%) on Wednesday.
 According to the 288 fires from years 2002 - 2018 most fires (12.2%) took place during July, and the least (6.3%) in October.
 Out of all 2,953 cases reported during the years 2002 - 2018, the most belonged to the categories: Overpressure Rupture (64.9%), Rescue & EMS (11.3%), and Fire (9.8%).
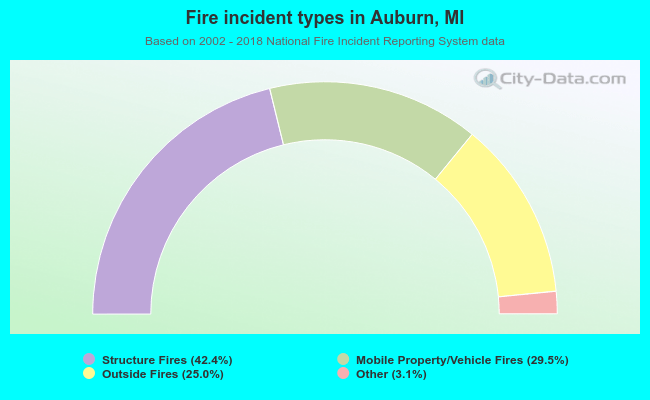 When looking into fire subcategories, the most incidents belonged to: Structure Fires (42.4%), and Mobile Property/Vehicle Fires (29.5%).