Avon: Fire Incidents, Indiana (IN)
Where are fire incidents reported in Avon, IN
Something went wrong! Please refresh the page.
|
| |||||||||||||||||||||||||||||||||||||||||||||||||||||||||||||||||||||||||||||||||||||||||||||||||||||||||||||
| Other | 192 | |||||||||||||||||||||||||||||||||||||||||||||||||||||||||||||||||||||||||||||||||||||||||||||||||||||||||||||
2002 - 2017 National Fire Incident Reporting System (NFIRS) incidents
- Incident types reported to NFIRS in Avon, IN
- 5,66953.9%Rescue & EMS
- 1,64615.7%Fire
- 1,05810.1%Good Intent Call
- 8448.0%Service Call
- 7697.3%Hazardous Condition
- 4724.5%False Alarm
- 230.2%Severe Weather
- 210.2%Overpressure Rupture
- Fire incident types reported to NFIRS in Avon, IN
- 75345.7%Structure Fires
- 64038.9%Outside Fires
- 16710.1%Mobile Property/Vehicle Fires
- 865.2%Other
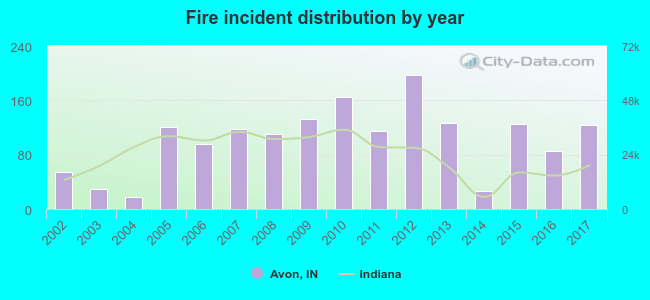 According to the data from the years 2002 - 2017 the average number of fires per year is 103. The highest number of reported fire incidents - 197 took place in 2012, and the least - 17 in 2004. The data has an increasing trend.
The average number of yearly fire incidents per 10k residents in Avon, IN compared to nearest cities:
(Note: Based on data for the last 3 years, including only cities with population 5,000 and above)
| Avon: | 44.2 |
| Plainfield: | 9.8 |
| Brownsburg: | 19.2 |
| Danville: | 44.1 |
| Speedway: | 40.2 |
| Mooresville: | 102.3 |
| Indianapolis: | 5.2 |
| Zionsville: | 16.1 |
| Beech Grove: | 10.3 |
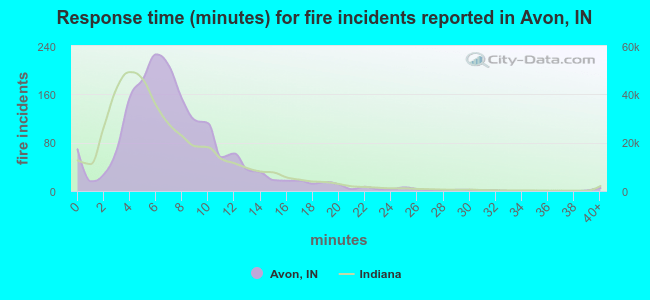 The median response time based on all reported fire incidents is 7 minutes. This is about the same as the state median value.
The median response time in Avon, IN compared to nearest cities:
(Note: Based on data for all years, including only cities with at least 500 fire incidents)
| Avon: | 7 minutes |
| Plainfield: | 6 minutes |
| Brownsburg: | 6 minutes |
| Danville: | 8 minutes |
| Clayton: | 10 minutes |
| Mooresville: | 6 minutes |
| Indianapolis: | 6 minutes |
| Zionsville: | 6 minutes |
| Beech Grove: | 4 minutes |
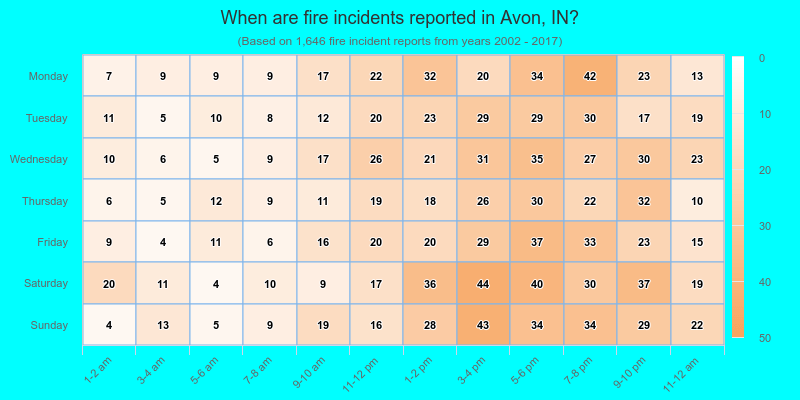
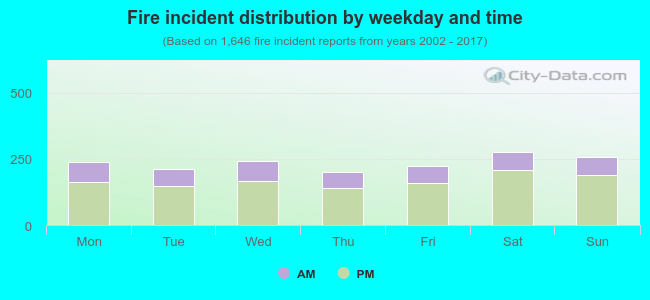 29.0% incidents where reported in the morning and 71.0% in the evening. The most fires (16.8%) took place on Saturday, and the least (12.2%) on Thursday.
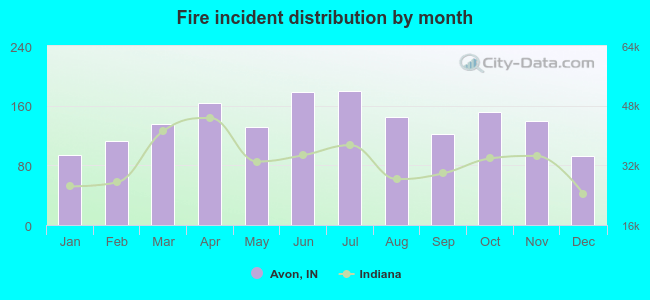 According to the 1,646 reports from years 2002 - 2017 most fires (10.9%) took place during July, and the least (5.6%) in December.
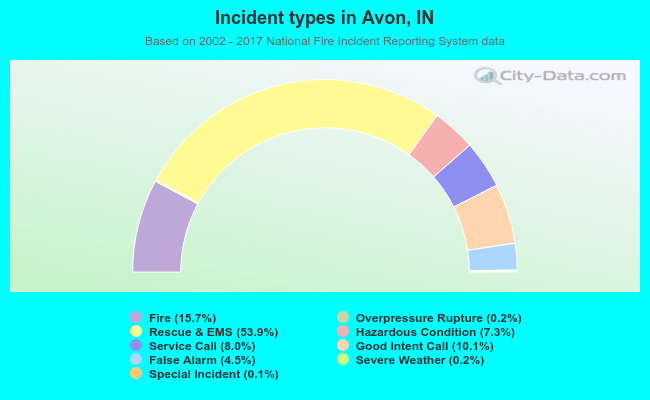 Out of all 10,510 cases reported during the years 2002 - 2017, the most belonged to the categories: Rescue & EMS (53.9%), Fire (15.7%), and Good Intent Call (10.1%).
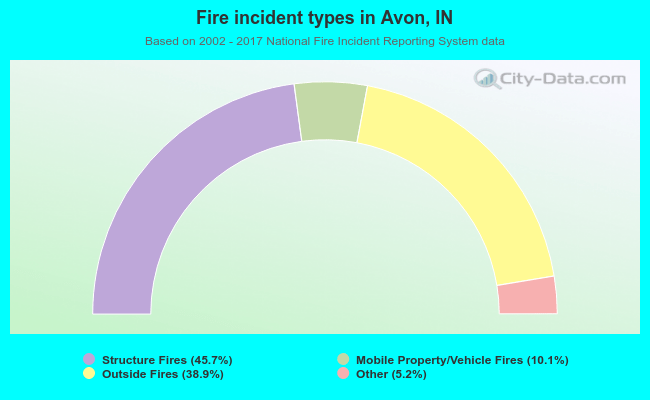 When looking into fire subcategories, the most incidents belonged to: Structure Fires (45.7%), and Outside Fires (38.9%).