| Fire incidents reported |
|---|
| Sreet name | Count |
|---|
| FRONT STREET | 6 | | 68 US 51 SOUTH | 4 | | 79 EAST COURT STREET | 4 | | COURT ST | 4 | | ST RT 123 WEST | 4 | | ST RT 1371 SOUTH | 4 | | 100 MARGO LANE | 2 | | 107 MIDDLE STREET ST | 2 | | 1100 KY 1181 | 2 | | 125 COLLEGE ST | 2 | | 1272 US HWY 1372 | 2 | | 128 SR HWY 62 EAST HWY | 2 | | 1297 SR 548 | 2 | | 1301 ST RT 1203 | 2 | | 1371 ST RT 1181 | 2 | | 1444 ST RT 1377 | 2 | | 154 ST RT 123 WEST | 2 | | 156 US HWY 62 | 2 | | 159 | 2 | | 1602 SR 1181 | 2 | | 1915 CR1002 | 2 | | 200 FRONT STREET | 2 | | 2000 BLOCK OF ST.RT. 408 | 2 | | 2000 HWY 51 N | 2 | | 200ELM ST | 2 |
| | | Fire incidents reported |
|---|
| Sreet name | Count |
|---|
| 203 COUNTY ROAD 1320 | 2 | | 2045 ST RT 123 | 2 | | 209 COURT ST | 2 | | 2110 COUNTY ROAD 1308 | 2 | | 2214 HIGHWAY 1371 | 2 | | 2231 US HWY 51 NORTH | 2 | | 226 CR 1134 | 2 | | 2310 STATE ROUTE 1372 | 2 | | 2468 STATE ROUTE 1203 | 2 | | 251 ELM STREET | 2 | | 259 CO RD 1014 | 2 | | 2707 SR 1741 | 2 | | 274 CR 1013 | 2 | | 277 COUNTY ROAD 1322 | 2 | | 277 CR 1003 | 2 | | 2815 US HWY 62 | 2 | | 282 CR 1006 | 2 | | 300 NORTH FRONT STREET | 2 | | 363 HWY 62 E | 2 | | 4000 SR307 | 2 | | 4000 ST. RT. 1377 | 2 | | 405 US HWY 62 STS | 2 | | 4276 1371S | 2 | | 455 HWY 62 EAST | 2 | | 5000 KY 121S | 2 |
|
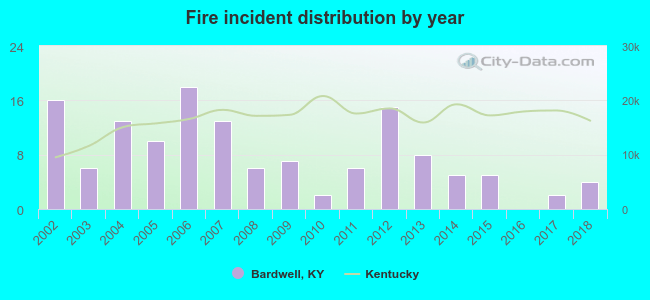 Based on the data from the years 2002 - 2018 the average number of fires per year is 8. The highest number of reported fire incidents - 18 took place in 2006, and the least - 0 in 2016. The data has a dropping trend.
 35.3% incidents where reported in the morning and 64.7% in the evening. The most fires (20.6%) took place on Sunday, and the least (10.3%) on Friday.
 Based on the 136 incident reports from years 2002 - 2018 most fires (15.4%) took place during September, and the least (4.4%) in October.
 Out of all 217 cases reported during the years 2002 - 2018, the most belonged to the categories: Fire (62.7%), Rescue & EMS (12.0%), and Service Call (7.8%).
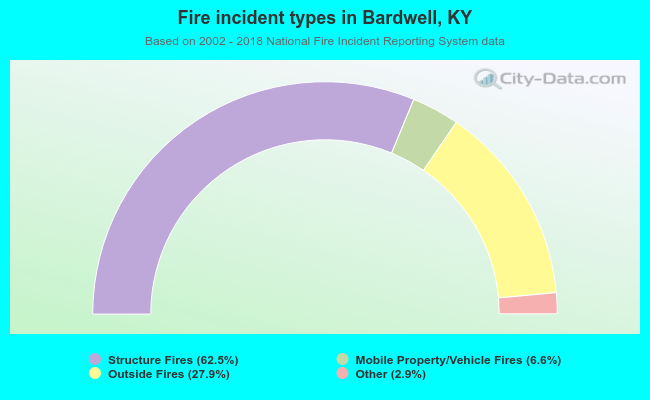 When looking into fire subcategories, the most incidents belonged to: Structure Fires (62.5%), and Outside Fires (27.9%).