Bayport: Fire Incidents, Minnesota (MN)
Where are fire incidents reported in Bayport, MN
Something went wrong! Please refresh the page.
|
| |||||||||||||||||||||||||||||||||||||||||||||||||||||||||||||||||||||||||||||||||||||||||||||||||
2002 - 2017 National Fire Incident Reporting System (NFIRS) incidents
- Incident types reported to NFIRS in Bayport, MN
- 92965.6%Rescue & EMS
- 17312.2%Hazardous Condition
- 1228.6%Fire
- 815.7%Good Intent Call
- 553.9%False Alarm
- 322.3%Service Call
- 241.7%Overpressure Rupture
- Fire incident types reported to NFIRS in Bayport, MN
- 6754.9%Structure Fires
- 2117.2%Outside Fires
- 1915.6%Mobile Property/Vehicle Fires
- 1512.3%Other
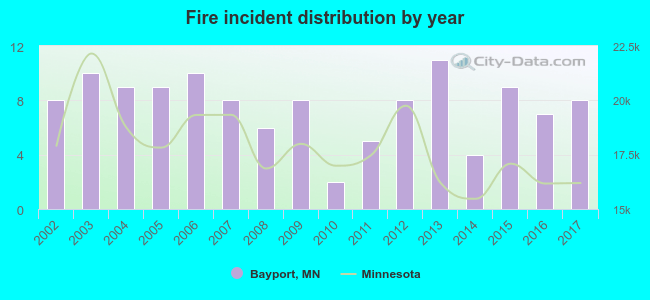 According to the data from the years 2002 - 2017 the average number of fires per year is 8. The highest number of reported fire incidents - 11 took place in 2013, and the least - 2 in 2010. The data has a constant trend.
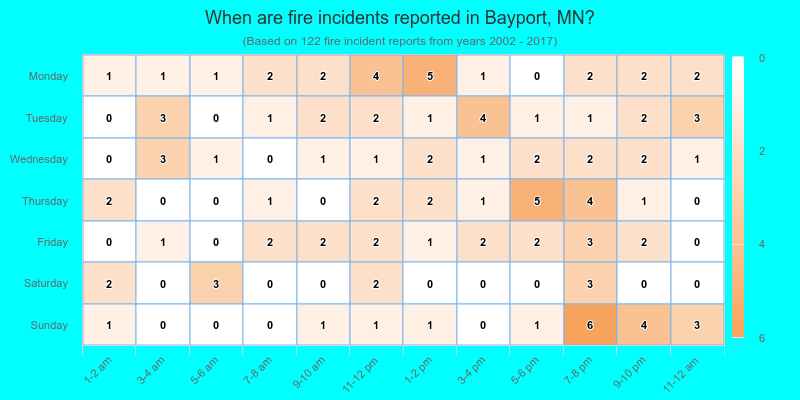
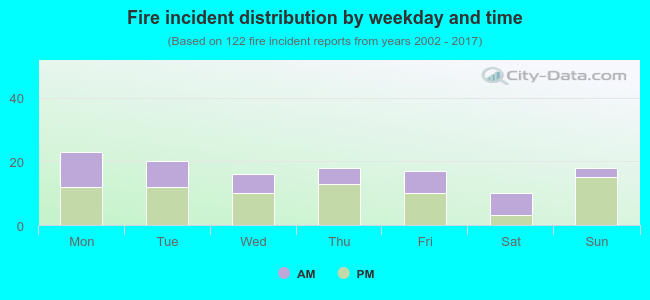 38.5% incidents where reported in the morning and 61.5% in the evening. The most fires (18.9%) took place on Monday, and the least (8.2%) on Saturday.
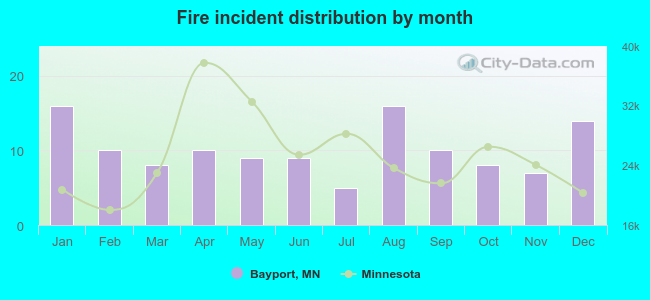 According to the 122 fire incident reports from years 2002 - 2017 most fires (13.1%) took place during January, and the least (4.1%) in July.
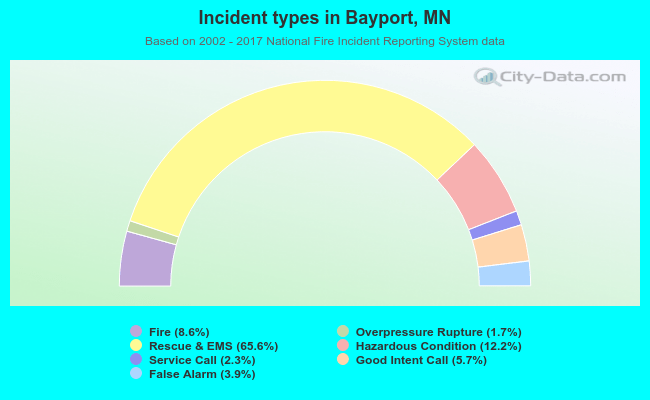 Out of all 1,416 cases reported during the years 2002 - 2017, the most belonged to the categories: Rescue & EMS (65.6%), Hazardous Condition (12.2%), and Fire (8.6%).
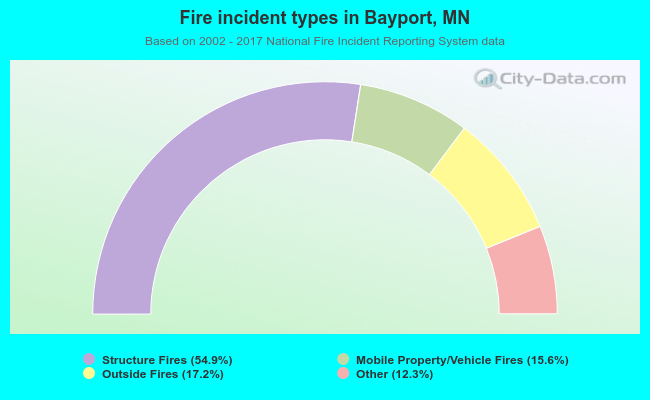 When looking into fire subcategories, the most reports belonged to: Structure Fires (54.9%), and Outside Fires (17.2%).