Beach: Fire Incidents, North Dakota (ND)
Where are fire incidents reported in Beach, ND
Something went wrong! Please refresh the page.
|
| |||||||||||||||||||||||||||||||||||||||||||||
| Other | 109 | |||||||||||||||||||||||||||||||||||||||||||||
2003 - 2018 National Fire Incident Reporting System (NFIRS) incidents
- Incident types reported to NFIRS in Beach, ND
- 18151.9%Fire
- 6618.9%Hazardous Condition
- 4914.0%Good Intent Call
- 277.7%Service Call
- 123.4%Rescue & EMS
- 102.9%False Alarm
- 41.1%Severe Weather
- Fire incident types reported to NFIRS in Beach, ND
- 11664.1%Outside Fires
- 3519.3%Mobile Property/Vehicle Fires
- 2916.0%Structure Fires
- 10.6%Other
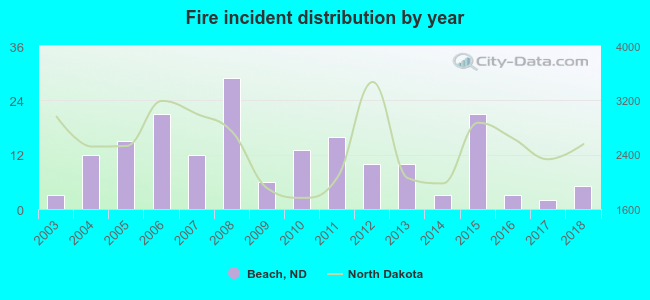 According to the data from the years 2003 - 2018 the average number of fires per year is 11. The highest number of fire incidents - 29 took place in 2008, and the least - 2 in 2017. The data has a rising trend.
 37.0% incidents where reported in the morning and 63.0% in the evening. The most fires (18.2%) took place on Saturday, and the least (9.9%) on Thursday.
 Based on the 181 incident reports from years 2003 - 2018 most fires (18.8%) took place during August, and the least (2.8%) in November.
 Out of all 349 cases reported during the years 2003 - 2018, the most belonged to the categories: Fire (51.9%), Rescue & EMS (18.9%), and Service Call (14.0%).
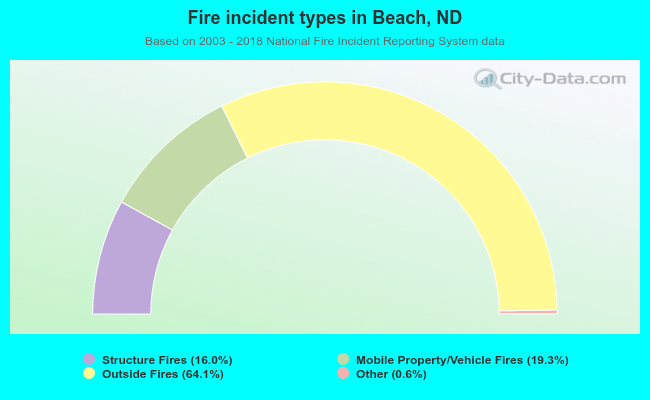 When looking into fire subcategories, the most incidents belonged to: Outside Fires (64.1%), and Mobile Property/Vehicle Fires (19.3%).