Beatrice: Fire Incidents, Nebraska (NE)
Where are fire incidents reported in Beatrice, NE
Something went wrong! Please refresh the page.
| Fire incidents reported | |
|---|---|
| Sreet name | Count |
| 6TH ST | 150 |
| COURT ST | 136 |
| SCOTT ST | 68 |
| ELLA ST | 60 |
| LINCOLN ST | 42 |
| MARKET ST | 42 |
| 10TH ST | 36 |
| 9TH ST | 36 |
| 5TH ST | 34 |
| ELK ST | 32 |
| SUMNER | 30 |
| 11TH ST | 28 |
| 4TH ST | 28 |
| 8TH ST | 28 |
| MARY ST | 26 |
| GRANT ST | 24 |
| LOCUST RD | 24 |
| PARK ST | 24 |
| 13TH ST | 22 |
| HIGH ST | 22 |
| BELL ST | 20 |
| CHEYENNE DR | 20 |
| HWY 77 | 20 |
| 19TH ST | 18 |
| 2ND ST | 18 |
| 7TH ST | 18 |
| ASHLAND AVE | 18 |
| MERIWETHER ST | 18 |
| SARGENT RD | 18 |
| GRAHAM ST | 14 |
| Other | 404 |
2002 - 2018 National Fire Incident Reporting System (NFIRS) incidents
- Incident types reported to NFIRS in Beatrice, NE
- 5,99865.6%Rescue & EMS
- 1,47816.2%Fire
- 6557.2%Hazardous Condition
- 4294.7%False Alarm
- 3774.1%Good Intent Call
- 1902.1%Service Call
- 120.1%Special Incident
- Fire incident types reported to NFIRS in Beatrice, NE
- 76952.0%Outside Fires
- 36624.8%Structure Fires
- 27218.4%Mobile Property/Vehicle Fires
- 714.8%Other
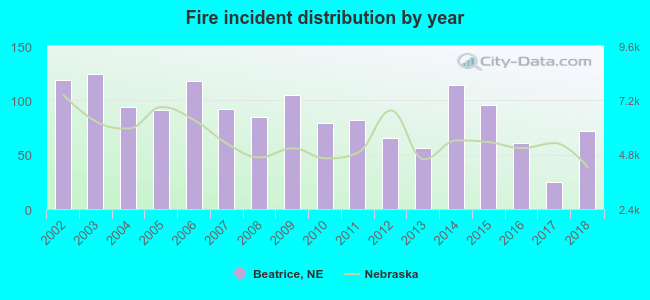 According to the data from the years 2002 - 2018 the average number of fires per year is 87. The highest number of fires - 124 took place in 2003, and the least - 25 in 2017. The data has a dropping trend.
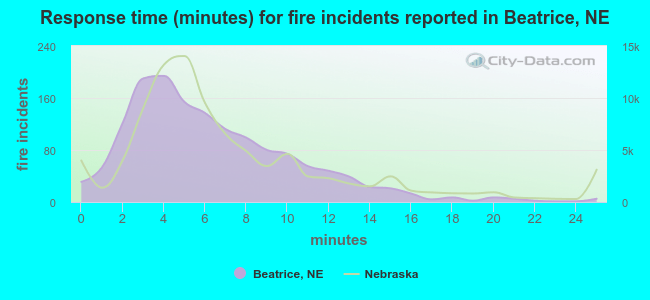 The median response time based on all reported fire incidents is 5 minutes. This is lower compared to the state median value.
The median response time in Beatrice, NE compared to nearest cities:
(Note: Based on data for all years, including only cities with at least 500 fire incidents)
| Beatrice: | 5 minutes |
| Lincoln: | 3 minutes |
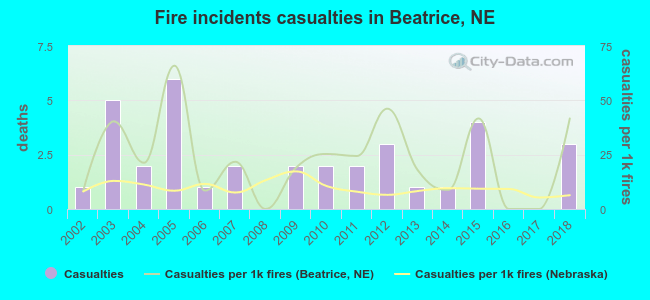 According to the data from the years 2002 - 2018 the average number of fire-related yearly casualties is 2. The highest number of casualties - 6 took place in 2005, and the lowest - 0 in 2008. The data has an increasing trend.
The average number of casualties per 1,000 fires is 23. This indicator was the highest - 66 in 2005, and the lowest 0 in 2008. The trend for casualties per 1,000 fire incidents is increasing. Compared to the Nebraska value the number of casualties per 1,000 fire incidents is much higher.
According to the data from the years 2002 - 2018 the average number of fire-related yearly casualties is 2. The highest number of casualties - 6 took place in 2005, and the lowest - 0 in 2008. The data has an increasing trend.
The average number of casualties per 1,000 fires is 23. This indicator was the highest - 66 in 2005, and the lowest 0 in 2008. The trend for casualties per 1,000 fire incidents is increasing. Compared to the Nebraska value the number of casualties per 1,000 fire incidents is much higher.Casualties per 1,000 incidents in Beatrice, NE compared to nearest cities:
(Note: Based on data for all years, including only cities with at least 500 fire incidents)
| Beatrice: | 23.7 |
| Lincoln: | 10.0 |
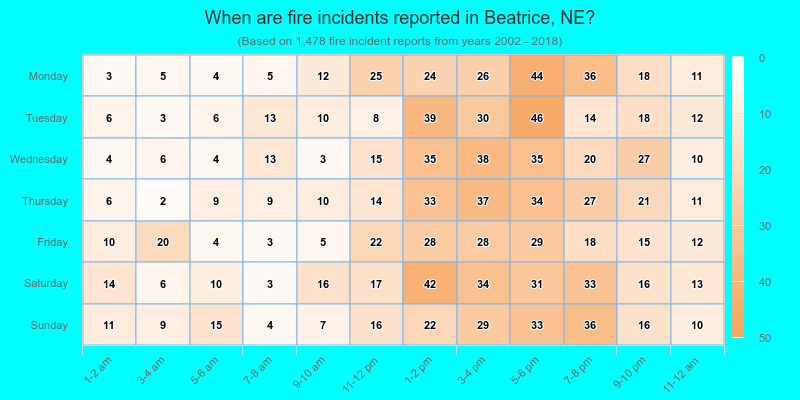
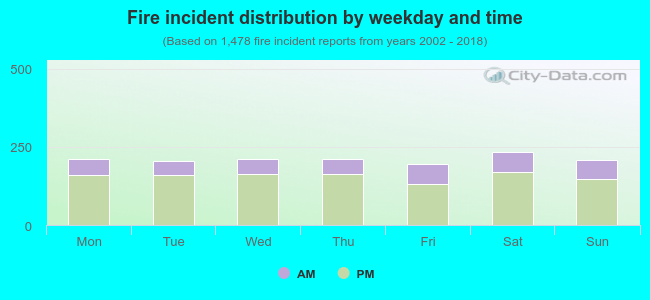 26.2% incidents where reported in the morning and 73.8% in the evening. The most fires (15.9%) took place on Saturday, and the least (13.1%) on Friday.
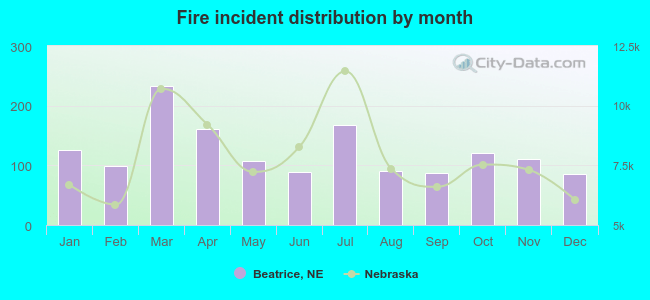 Based on the 1,478 fires from years 2002 - 2018 most fires (15.8%) took place during March, and the least (5.8%) in December.
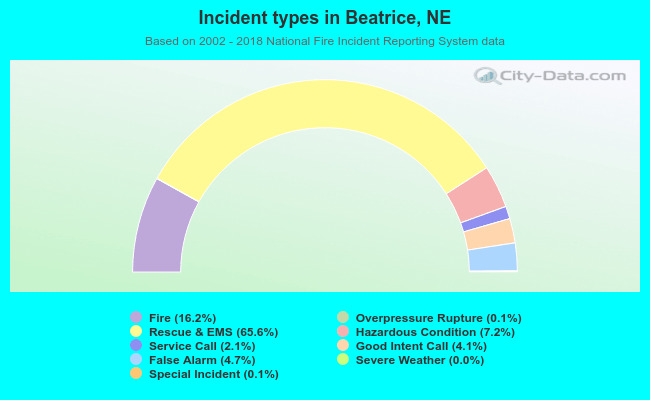 Out of all 9,147 cases reported during the years 2002 - 2018, the most belonged to the categories: Rescue & EMS (65.6%), Fire (16.2%), and Hazardous Condition (7.2%).
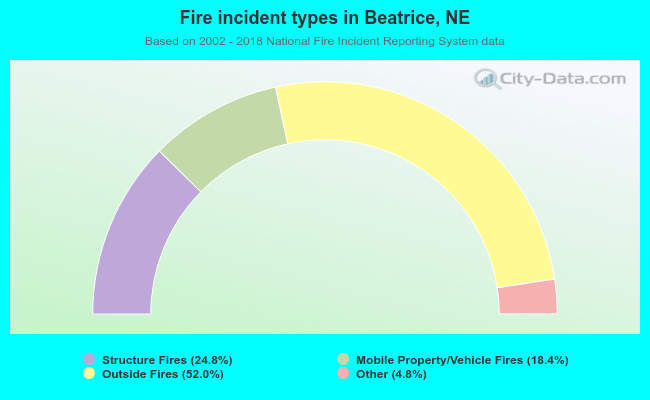 When looking into fire subcategories, the most reports belonged to: Outside Fires (52.0%), and Structure Fires (24.8%).