| Fire incidents reported |
|---|
| Sreet name | Count |
|---|
| BEDFORD VALLEY ROAD | 34 | | PENNSYLVANIA TURNPIKE | 26 | | EVITTS CREEK ROAD | 24 | | PITT ST | 22 | | BUS. RT. 220 | 18 | | PITT STREET | 18 | | BUS RT 220 | 14 | | BUSINESS RT 220 SOUTH | 14 | | LINCOLN HIGHWAY | 14 | | LINCOLN HWY | 14 | | BELDEN RD | 12 | | BRIAR VALLEY ROAD RD | 12 | | BUSINESS ROUTE 220 | 12 | | CHALYBEATE RD | 12 | | EGOLF RD | 12 | | BUSINESS 220 | 10 | | IMLERTOWN RD | 10 | | SAWBLADE ROAD | 10 | | BLACK WALNUT | 8 | | CENTERVILLE ROAD | 8 | | DIEHL RD | 8 | | JULIANA STREET ST | 8 | | PITT ST. | 8 | | TEABERRY ROAD | 8 | | BLANKLEY ROAD | 6 |
| | | Fire incidents reported |
|---|
| Sreet name | Count |
|---|
| BUSINESS RT 220 NORTH RD | 6 | | CENTENNIAL RD | 6 | | CENTRAL WAY | 6 | | CUMBERLAND RD | 6 | | EGOLF ROAD | 6 | | GREEN LN | 6 | | LAKE GORDON ROAD | 6 | | MAIN RD | 6 | | MAIN ROAD | 6 | | OTT TOWN RD | 6 | | PENN STREET | 6 | | RICHARD STREET | 6 | | SUNNYSIDE ROAD | 6 | | TEABERRY RD | 6 | | TRANSPORT ST | 6 | | WEST PITT STREET | 6 | | WILLS MOUNTAIN | 6 | | ARANDALE ST | 4 | | ASSIST CO 32 | 4 | | BLANKLEY PARK | 4 | | BRIAR VALLEY ROAD | 4 | | BUSINESS RT 220 | 4 | | CHALYBEATE RD | 4 | | CHALYBEATE ROAD | 4 | | |
|
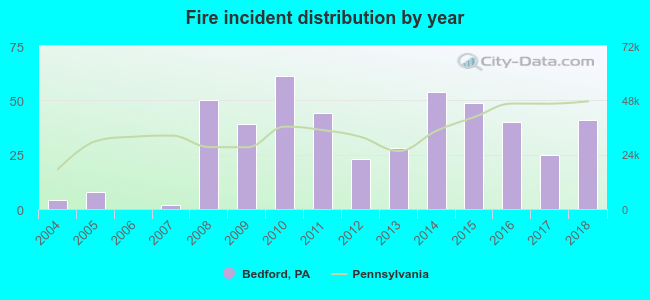 Based on the data from the years 2004 - 2018 the average number of fires per year is 31. The highest number of reported fire incidents - 61 took place in 2010, and the least - 0 in 2006. The data has an increasing trend.
 31.6% incidents where reported in the morning and 68.4% in the evening. The most fires (17.5%) took place on Saturday, and the least (12.0%) on Wednesday.
 Based on the 468 fires from years 2004 - 2018 most fires (14.7%) took place during February, and the least (4.7%) in July.
 Out of all 1,788 cases reported during the years 2004 - 2018, the most belonged to the categories: Fire (26.2%), Severe Weather (24.3%), and Hazardous Condition (21.0%).
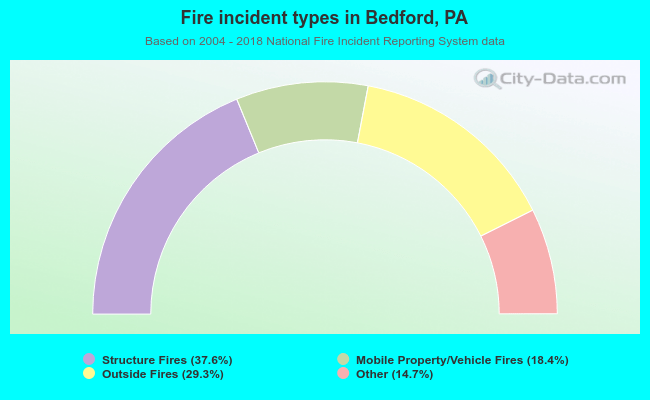 When looking into fire subcategories, the most incidents belonged to: Structure Fires (37.6%), and Outside Fires (29.3%).