Belton: Fire Incidents, Texas (TX)
Where are fire incidents reported in Belton, TX
Something went wrong! Please refresh the page.
| Fire incidents reported | |
|---|---|
| Sreet name | Count |
| FM 439 | 138 |
| IH 35 | 114 |
| HWY 190 | 82 |
| LOOP 121 | 68 |
| SPARTA RD | 62 |
| MAIN | 56 |
| MAIN ST | 50 |
| SHADY LN | 46 |
| 190 | 38 |
| SHADY LANE | 38 |
| FM 1670 | 36 |
| FM 1123 | 32 |
| 6TH AVE | 26 |
| FM 93 | 26 |
| PEARL ST | 26 |
| SPARTA | 26 |
| US HWY 190 | 26 |
| HIGHWAY 190 | 24 |
| WALL | 24 |
| AVE O | 22 |
| TAYLORS VALLEY RD | 22 |
| US 190 | 22 |
| LAKE RD | 20 |
| 2ND | 18 |
| 6TH | 18 |
| CONNELL | 18 |
| ELM GROVE RD | 18 |
| FM 436 | 18 |
| HOLLAND RD | 18 |
| I-35 | 18 |
| Other | 1,158 |
2002 - 2018 National Fire Incident Reporting System (NFIRS) incidents
- Incident types reported to NFIRS in Belton, TX
- 6,12050.8%Rescue & EMS
- 2,30819.2%Fire
- 1,25010.4%Hazardous Condition
- 1,23210.2%Good Intent Call
- 5614.7%False Alarm
- 5094.2%Service Call
- 440.4%Special Incident
- 220.2%Overpressure Rupture
- Fire incident types reported to NFIRS in Belton, TX
- 1,21352.6%Outside Fires
- 63627.6%Structure Fires
- 36615.9%Mobile Property/Vehicle Fires
- 934.0%Other
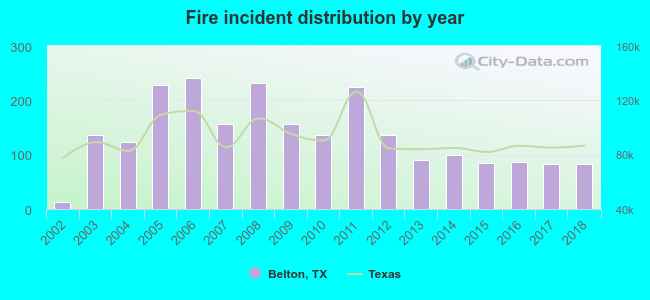 According to the data from the years 2002 - 2018 the average number of fires per year is 136. The highest number of fire incidents - 241 took place in 2006, and the least - 12 in 2002. The data has a rising trend.
The average number of yearly fire incidents per 10k residents in Belton, TX compared to nearest cities:
(Note: Based on data for the last 3 years, including only cities with population 5,000 and above)
| Belton: | 41.4 |
| Temple: | 47.9 |
| Harker Heights: | 32.6 |
| Killeen: | 35.7 |
| Fort Hood: | 0.7 |
| Jarrell: | 52.8 |
| McGregor: | 8.6 |
| Copperas Cove: | 38.1 |
| Gatesville: | 122.6 |
 The median response time based on all reported fire incidents is 7 minutes. This is about the same as the Texas median value.
The median response time in Belton, TX compared to nearest cities:
(Note: Based on data for all years, including only cities with at least 500 fire incidents)
| Belton: | 7 minutes |
| Temple: | 6 minutes |
| Salado: | 9 minutes |
| Harker Heights: | 6 minutes |
| Killeen: | 6 minutes |
| Jarrell: | 7 minutes |
| Florence: | 10 minutes |
| Copperas Cove: | 5 minutes |
| Gatesville: | 10 minutes |
 Based on the reports from the years 2002 - 2018 the average number of fire-related casualties per year is 1. The highest number of reported injuries - 9 took place in 2007, and the lowest - 0 in 2002. The data has a constant trend.
The average number of injuries per 1,000 fires is 8. This indicator was the highest - 58 in 2007, and the lowest 0 in 2002. The trend for injuries per 1,000 fire incidents is constant. Compared to the Texas value the number of injuries per 1,000 incidents is about the same.
Based on the reports from the years 2002 - 2018 the average number of fire-related casualties per year is 1. The highest number of reported injuries - 9 took place in 2007, and the lowest - 0 in 2002. The data has a constant trend.
The average number of injuries per 1,000 fires is 8. This indicator was the highest - 58 in 2007, and the lowest 0 in 2002. The trend for injuries per 1,000 fire incidents is constant. Compared to the Texas value the number of injuries per 1,000 incidents is about the same.Casualties per 1,000 incidents in Belton, TX compared to nearest cities:
(Note: Based on data for all years, including only cities with at least 500 fire incidents)
| Belton: | 9.1 |
| Temple: | 23.6 |
| Salado: | 0.0 |
| Harker Heights: | 16.6 |
| Killeen: | 13.0 |
| Jarrell: | 3.6 |
| Florence: | 7.4 |
| Copperas Cove: | 26.7 |
| Gatesville: | 11.2 |
 27.4% incidents where reported in the morning and 72.6% in the evening. The most fires (15.4%) took place on Tuesday, and the least (12.8%) on Thursday.
 Based on the 2,308 fire incidents from years 2002 - 2018 most fires (11.0%) took place during July, and the least (6.8%) in October.
 Out of all 12,052 cases reported during the years 2002 - 2018, the most belonged to the categories: Rescue & EMS (50.8%), Fire (19.2%), and Hazardous Condition (10.4%).
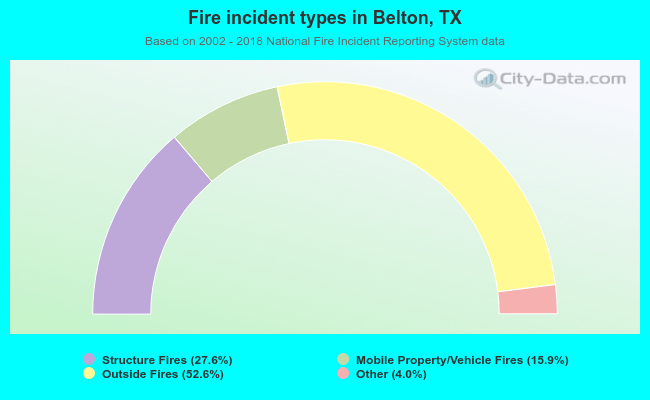 When looking into fire subcategories, the most reports belonged to: Outside Fires (52.6%), and Structure Fires (27.6%).