| Fire incidents reported |
|---|
| Sreet name | Count |
|---|
| HWY NN | 12 | | B HWY | 8 | | CO RD 736 | 6 | | HWY B | 6 | | MARIES CO RD 403 | 6 | | 152 RIVERVIEW TRL | 4 | | 200 E MISSOURI AVE | 4 | | 25854 HWY C | 4 | | 34783 MARIES CO RD 405 | 4 | | 3886 SPURGEON RD | 4 | | 3950 HWY B | 4 | | 4001 HWY B | 4 | | 4002 HOLT RD | 4 | | 4218 HWY B | 4 | | 4382 HWY EE | 4 | | ELK HEAD RD | 4 | | GORRELL RD | 4 | | HIGHWAY B | 4 | | HWY 28 | 4 | | HWY U | 4 | | RED BIRD ROAD | 4 | | REDBIRD RD | 4 | | SCHNEIDER RD | 4 | | STATE 28 HWY | 4 | | U HWY | 4 |
| | | Fire incidents reported |
|---|
| Sreet name | Count |
|---|
| 1008 HWY D | 2 | | 1048 KOEBEL RD | 2 | | 105 W KANSAS CITY AVE | 2 | | 1174 CO RD 754 | 2 | | 1190 HWY U | 2 | | 1200 HWY 28 | 2 | | 1220 HWY CC | 2 | | 1234 REHMERT RD | 2 | | 1254 REHMERT RD | 2 | | 1257 CROSSROADS CHURCH RD | 2 | | 1265 REHMERT RD | 2 | | 1279 BOCK RD | 2 | | 1301 HWY U | 2 | | 1312 HWY 28 | 2 | | 133 QUARTER HORSE LN | 2 | | 1352 DITTMAN RD | 2 | | 1367 SCHNEIDER RD | 2 | | 1373 SCHNIDER RD | 2 | | 1380 HWY 28 HWY | 2 | | 1406 RED BIRD ST. | 2 | | 1504 HWY NN | 2 | | 1505 HWY NN | 2 | | 1720 HWY NN | 2 | | 200 N VICTOR | 2 | | |
|
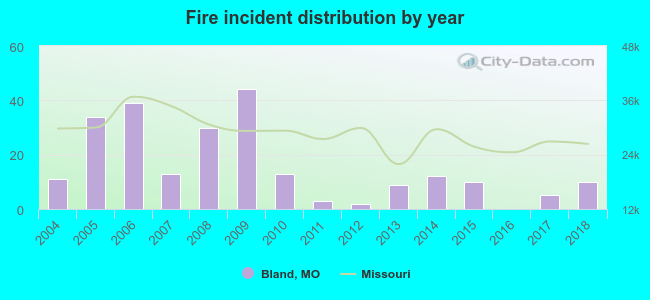 According to the data from the years 2004 - 2018 the average number of fires per year is 16. The highest number of reported fires - 44 took place in 2009, and the least - 0 in 2016. The data has a dropping trend.
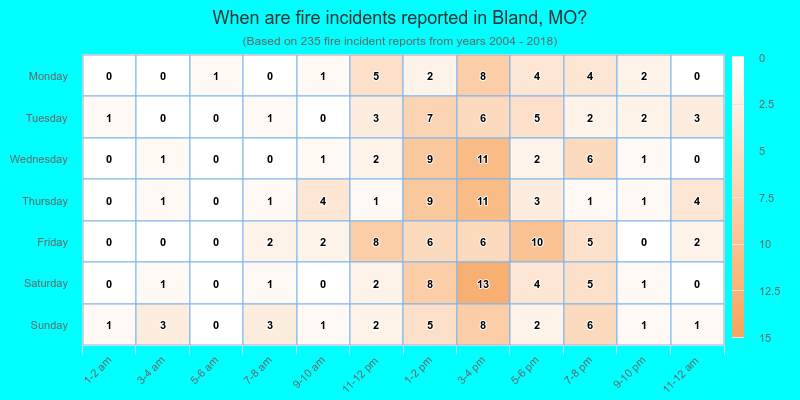
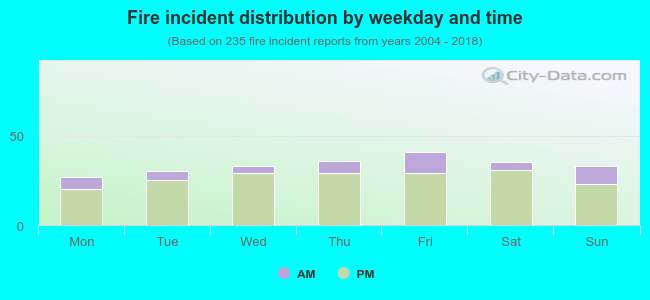 20.9% incidents where reported in the morning and 79.1% in the evening. The most fires (17.4%) took place on Friday, and the least (11.5%) on Monday.
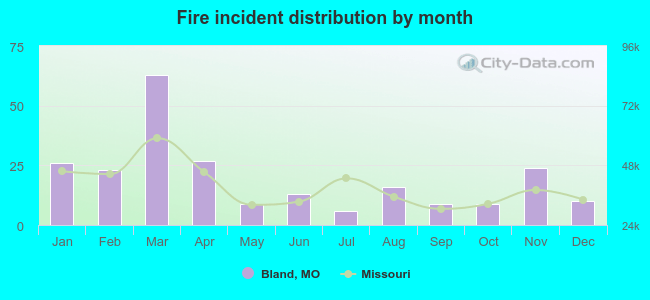 Based on the 235 fire incidents from years 2004 - 2018 most fires (26.8%) took place during March, and the least (2.6%) in July.
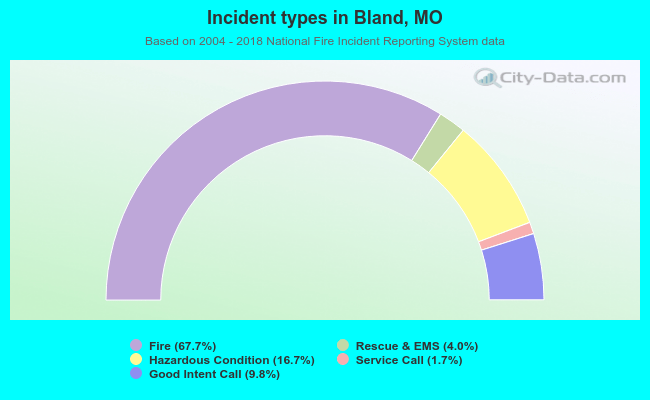 Out of all 347 cases reported during the years 2004 - 2018, the most belonged to the categories: Fire (67.7%), Rescue & EMS (16.7%), and Service Call (9.8%).
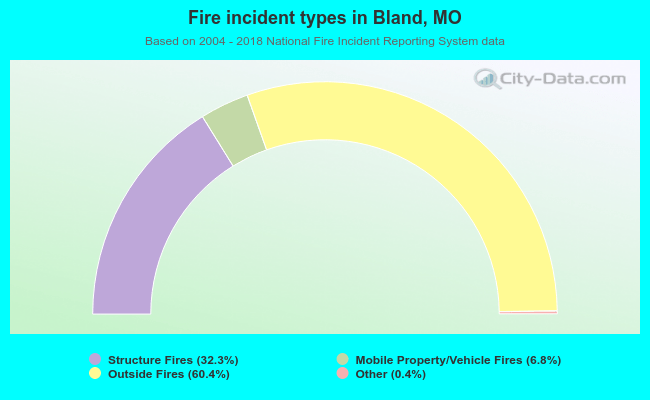 When looking into fire subcategories, the most incidents belonged to: Outside Fires (60.4%), and Structure Fires (32.3%).