Booneville: Fire Incidents, Mississippi (MS)
Where are fire incidents reported in Booneville, MS
Something went wrong! Please refresh the page.
| Fire incidents reported | |
|---|---|
| Sreet name | Count |
| SECOND ST | 248 |
| 4 HWY | 166 |
| CHAMBERS DR | 154 |
| 7301 RD | 132 |
| 45 HWY | 122 |
| CHURCH ST | 104 |
| 30 HWY | 100 |
| COLLEGE ST | 88 |
| CR 1101 | 86 |
| JACINTO RD | 80 |
| LAKE ST | 76 |
| HWY 365 | 68 |
| CR 1151 | 62 |
| HWY 364 | 62 |
| CR 1040 | 60 |
| CR 3101 | 56 |
| CR 5051 | 56 |
| 145 HWY | 54 |
| 7100 RD | 54 |
| CR 1371 | 54 |
| HATCHIE ST | 54 |
| 1101 RD | 52 |
| 5031 | 52 |
| CR 7301 | 50 |
| 7030 RD | 48 |
| 7301 | 48 |
| 8401 RD | 46 |
| CR 1219 | 46 |
| HWY 30 | 46 |
| HWY 4 | 46 |
| Other | 3,287 |
2002 - 2018 National Fire Incident Reporting System (NFIRS) incidents
- Incident types reported to NFIRS in Booneville, MS
- 5,65763.5%Fire
- 1,52017.1%Rescue & EMS
- 5856.6%Good Intent Call
- 4815.4%Hazardous Condition
- 3584.0%False Alarm
- 2673.0%Service Call
- 240.3%Special Incident
- 190.2%Severe Weather
- Fire incident types reported to NFIRS in Booneville, MS
- 2,63846.6%Outside Fires
- 2,04536.1%Structure Fires
- 58910.4%Mobile Property/Vehicle Fires
- 3856.8%Other
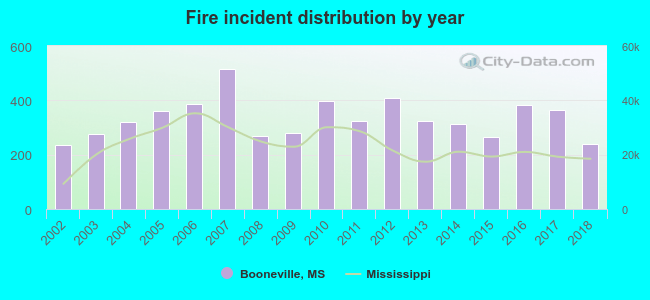 Based on the data from the years 2002 - 2018 the average number of fires per year is 333. The highest number of reported fire incidents - 514 took place in 2007, and the least - 237 in 2002. The data has a rising trend.
The average number of yearly fire incidents per 10k residents in Booneville, MS compared to nearest cities:
(Note: Based on data for the last 3 years, including only cities with population 5,000 and above)
| Booneville: | 373.3 |
| Corinth: | 172.7 |
| Saltillo: | 171.9 |
| Ripley: | 177.6 |
| New Albany: | 165.4 |
| Tupelo: | 81.8 |
| Pontotoc: | 260.7 |
| Amory: | 111.2 |
 The median response time based on all reported fire incidents is 10 minutes. This is higher than the state median value.
The median response time in Booneville, MS compared to nearest cities:
(Note: Based on data for all years, including only cities with at least 500 fire incidents)
| Booneville: | 10 minutes |
| Rienzi: | 11 minutes |
| Baldwyn: | 10 minutes |
| Marietta: | 9 minutes |
| Glen: | 8 minutes |
| Guntown: | 9 minutes |
| Burnsville: | 6 minutes |
| Tishomingo: | 9 minutes |
| Corinth: | 6 minutes |
 Based on the data from the years 2002 - 2018 the average number of fire-related yearly deaths is 1. The highest number of reported deaths - 3 took place in 2007, and the lowest - 0 in 2003. The data has an increasing trend.
The average number of fatalities per 1,000 fires is 2. This indicator was the highest - 8 in 2018, and the lowest 0 in 2003. The trend for fatalities per 1,000 fires is rising. Compared to the state value the number of fatalities per 1,000 fire incidents is similar.
Based on the data from the years 2002 - 2018 the average number of fire-related yearly deaths is 1. The highest number of reported deaths - 3 took place in 2007, and the lowest - 0 in 2003. The data has an increasing trend.
The average number of fatalities per 1,000 fires is 2. This indicator was the highest - 8 in 2018, and the lowest 0 in 2003. The trend for fatalities per 1,000 fires is rising. Compared to the state value the number of fatalities per 1,000 fire incidents is similar.Deaths per 1,000 incidents in Booneville, MS compared to nearest cities:
(Note: Based on data for all years, including only cities with at least 2,500 fire incidents)
| Booneville: | 2.5 |
| Corinth: | 2.0 |
| New Albany: | 0.8 |
| Tupelo: | 2.8 |
 According to the reports from the years 2002 - 2018 the average number of fire-related yearly casualties is 0. The highest number of injuries - 4 took place in 2012, and the lowest - 0 in 2005. The data has a decreasing trend.
The average number of casualties per 1,000 fire incidents is 1. This indicator was the highest - 10 in 2012, and the lowest 0 in 2005. The trend for injuries per 1,000 fire incidents is dropping. Compared to the Mississippi value the number of casualties per 1,000 fire incidents is much lower.
According to the reports from the years 2002 - 2018 the average number of fire-related yearly casualties is 0. The highest number of injuries - 4 took place in 2012, and the lowest - 0 in 2005. The data has a decreasing trend.
The average number of casualties per 1,000 fire incidents is 1. This indicator was the highest - 10 in 2012, and the lowest 0 in 2005. The trend for injuries per 1,000 fire incidents is dropping. Compared to the Mississippi value the number of casualties per 1,000 fire incidents is much lower.Casualties per 1,000 incidents in Booneville, MS compared to nearest cities:
(Note: Based on data for all years, including only cities with at least 500 fire incidents)
| Booneville: | 1.4 |
| Rienzi: | 1.5 |
| Baldwyn: | 2.0 |
| Marietta: | 0.0 |
| Glen: | 4.3 |
| Guntown: | 0.9 |
| Burnsville: | 0.0 |
| Tishomingo: | 0.0 |
| Corinth: | 3.6 |
 27.6% incidents where reported in the morning and 72.4% in the evening. The most fires (16.2%) took place on Saturday, and the least (12.7%) on Thursday.
 According to the 5,657 fires from years 2002 - 2018 most fires (16.9%) took place during March, and the least (6.0%) in June.
 Out of all 8,914 cases reported during the years 2002 - 2018, the most belonged to the categories: Fire (63.5%), Rescue & EMS (17.1%), and Good Intent Call (6.6%).
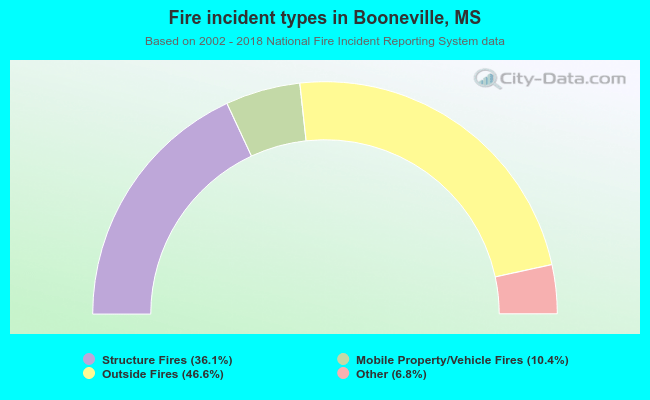 When looking into fire subcategories, the most reports belonged to: Outside Fires (46.6%), and Structure Fires (36.1%).