| Fire incidents reported |
|---|
| Sreet name | Count |
|---|
| MAIN ST | 8 | | MAIN | 6 | | RR 1 | 6 | | 1700 N | 4 | | BONITA AVE | 4 | | RR # 1 | 4 | | SECTION 29 MILO TOWNSHIP FLD | 4 | | 1 1/2 MILES EAST AIRPORT | 2 | | 1 1/2 MILES EAST OF AIRPORT FLD | 2 | | 1 MILE SOUTH OF BOYDS GROVE CH | 2 | | 100 BONITA AVE | 2 | | 100 NAOMI | 2 | | 1000 N 1500 E | 2 | | 1000 N 1600 E | 2 | | 10441 TR 1500 N | 2 | | 108 LINCOLN ST | 2 | | 108 SOUTH PEORIA | 2 | | 1100 E 1500 N | 2 | | 1100 N 800 E | 2 | | 1100E AND 1400N | 2 | | 11069 KENTVILLE RD | 2 | | 111 FIRST STREET | 2 | | 115 HIGH ST | 2 | | 1150 E ON RT 93 | 2 | | 116 PARD STREET | 2 |
| | | Fire incidents reported |
|---|
| Sreet name | Count |
|---|
| 11634 1310 N | 2 | | 120 BREEN | 2 | | 120 BREEN AVE. | 2 | | 1200 N 1400 E | 2 | | 1225 EAST ST 300 N | 2 | | 124 WEST MAIN | 2 | | 12427 800 N AVE | 2 | | 126 SECOND STREET | 2 | | 12654 N CASTLETON RD | 2 | | 1275 E 200 N | 2 | | 12832 100 N. AVE | 2 | | 130 SILVER ST. | 2 | | 1300 N 1100 E | 2 | | 1325 E STREET | 2 | | 1362 100 E | 2 | | 1377 OSCEOLO RD | 2 | | 1400 E 1550 N | 2 | | 1400 N 200 E | 2 | | 1425 200 N | 2 | | 14348 E 300 N | 2 | | 150 LINCOLN | 2 | | 1500 E 1690 N | 2 | | 1500 E OSCEOLA RD | 2 | | 1500 N 1500 E | 2 | | |
|
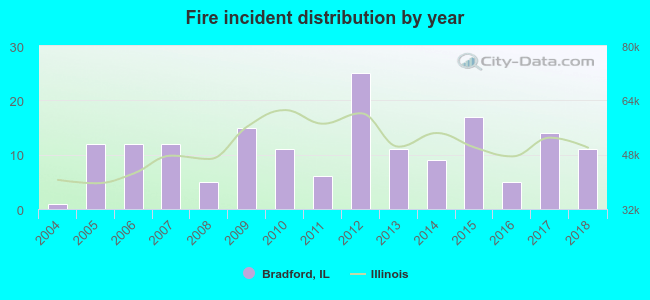 According to the data from the years 2004 - 2018 the average number of fire incidents per year is 11. The highest number of fire incidents - 25 took place in 2012, and the least - 1 in 2004. The data has an increasing trend.
 38.0% incidents where reported in the morning and 62.0% in the evening. The most fires (22.9%) took place on Sunday, and the least (7.2%) on Tuesday.
 According to the 166 incident reports from years 2004 - 2018 most fires (13.3%) took place during November, and the least (2.4%) in December.
 Out of all 321 cases reported during the years 2004 - 2018, the most belonged to the categories: Fire (51.7%), Overpressure Rupture (24.0%), and Rescue & EMS (13.1%).
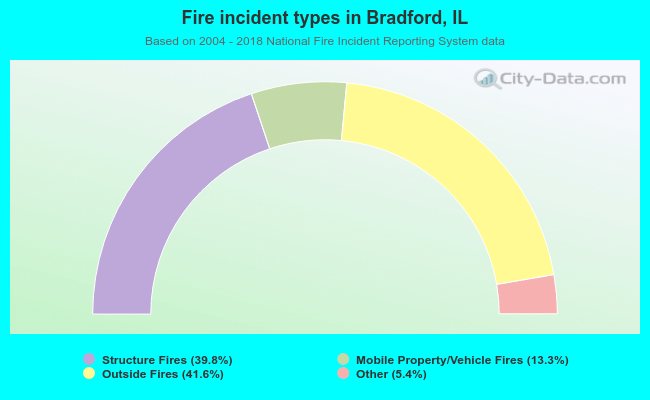 When looking into fire subcategories, the most reports belonged to: Outside Fires (41.6%), and Structure Fires (39.8%).