Breckenridge: Fire Incidents, Michigan (MI)
Where are fire incidents reported in Breckenridge, MI
Something went wrong! Please refresh the page.
|
| |||||||||||||||||||||||||||||||||||||||||||||||||||||||||||||||||||||||||||||||||||||||||||||||||||||||||||||
2002 - 2018 National Fire Incident Reporting System (NFIRS) incidents
- Incident types reported to NFIRS in Breckenridge, MI
- 25762.2%Fire
- 9924.0%Hazardous Condition
- 215.1%Rescue & EMS
- 184.4%Good Intent Call
- 71.7%Service Call
- 71.7%False Alarm
- 41.0%Severe Weather
- Fire incident types reported to NFIRS in Breckenridge, MI
- 15359.5%Structure Fires
- 6123.7%Outside Fires
- 3413.2%Mobile Property/Vehicle Fires
- 93.5%Other
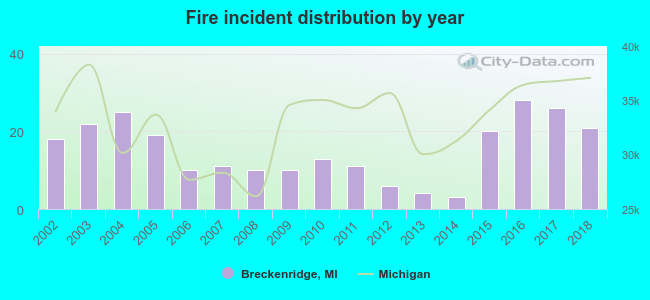 Based on the data from the years 2002 - 2018 the average number of fires per year is 15. The highest number of fires - 28 took place in 2016, and the least - 3 in 2014. The data has an increasing trend.
 31.1% incidents where reported in the morning and 68.9% in the evening. The most fires (16.7%) took place on Saturday, and the least (12.1%) on Wednesday.
 According to the 257 reports from years 2002 - 2018 most fires (13.6%) took place during November, and the least (4.7%) in October.
 Out of all 413 cases reported during the years 2002 - 2018, the most belonged to the categories: Fire (62.2%), Rescue & EMS (24.0%), and Overpressure Rupture (5.1%).
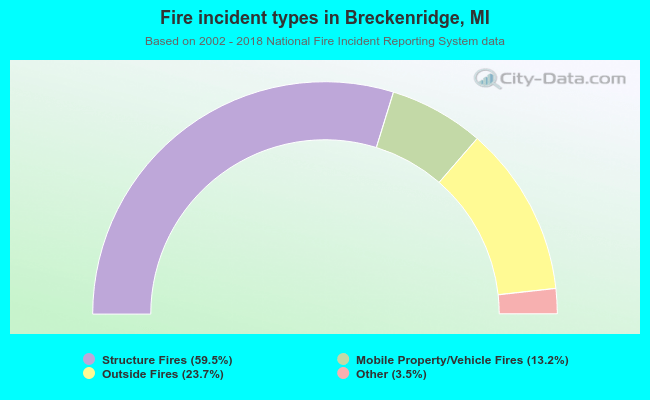 When looking into fire subcategories, the most reports belonged to: Structure Fires (59.5%), and Outside Fires (23.7%).