Brentwood: Fire Incidents, Maryland (MD)
Where are fire incidents reported in Brentwood, MD
Something went wrong! Please refresh the page.
|
| |||||||||||||||||||||||||||||||||||||||||||||||||||||||||||||||||||||||||||||||||||||||||||||||||||||||||||||
2009 - 2018 National Fire Incident Reporting System (NFIRS) incidents
- Incident types reported to NFIRS in Brentwood, MD
- 61841.1%Rescue & EMS
- 35123.3%Fire
- 33422.2%Hazardous Condition
- 1157.6%False Alarm
- 503.3%Service Call
- 362.4%Good Intent Call
- Fire incident types reported to NFIRS in Brentwood, MD
- 18753.3%Structure Fires
- 6017.1%Outside Fires
- 5616.0%Mobile Property/Vehicle Fires
- 4813.7%Other
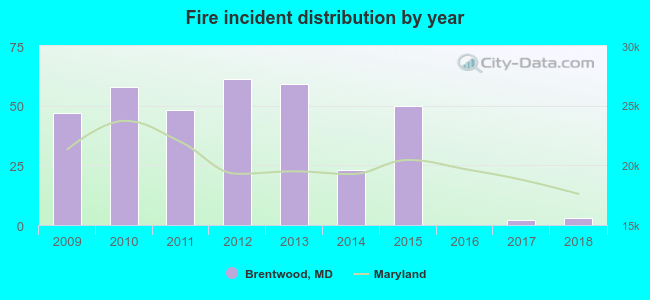 According to the data from the years 2009 - 2018 the average number of fire incidents per year is 35. The highest number of fire incidents - 61 took place in 2012, and the least - 0 in 2016. The data has a declining trend.
 Based on the data from the years 2009 - 2018 the average number of fire-related yearly casualties is 1. The highest number of injuries - 4 took place in 2011, and the lowest - 0 in 2010. The data has a dropping trend.
 34.2% incidents where reported in the morning and 65.8% in the evening. The most fires (17.7%) took place on Saturday, and the least (10.5%) on Tuesday.
 Based on the 351 fires from years 2009 - 2018 most fires (10.5%) took place during May, and the least (5.7%) in November.
 Out of all 1,505 cases reported during the years 2009 - 2018, the most belonged to the categories: Overpressure Rupture (41.1%), Fire (23.3%), and Rescue & EMS (22.2%).
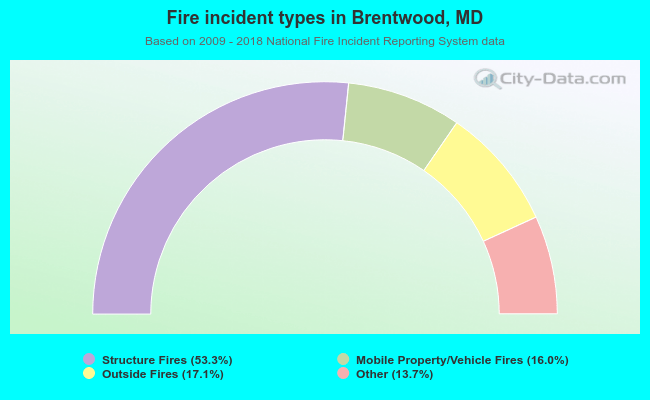 When looking into fire subcategories, the most incidents belonged to: Structure Fires (53.3%), and Outside Fires (17.1%).