Briaroaks: Fire Incidents, Texas (TX)
Where are fire incidents reported in Briaroaks, TX
Something went wrong! Please refresh the page.
|
| |||||||||||||||||||||||||||||||||||||||||||||||||||||||||||||||||||||||||||||||||||||||||||||||||||||||||||||
2005 - 2018 National Fire Incident Reporting System (NFIRS) incidents
- Incident types reported to NFIRS in Briaroaks, TX
- 51246.0%Rescue & EMS
- 34430.9%Good Intent Call
- 18016.2%Fire
- 443.9%Service Call
- 181.6%Hazardous Condition
- 131.2%False Alarm
- 20.2%Severe Weather
- Fire incident types reported to NFIRS in Briaroaks, TX
- 9552.8%Outside Fires
- 7441.1%Structure Fires
- 73.9%Mobile Property/Vehicle Fires
- 42.2%Other
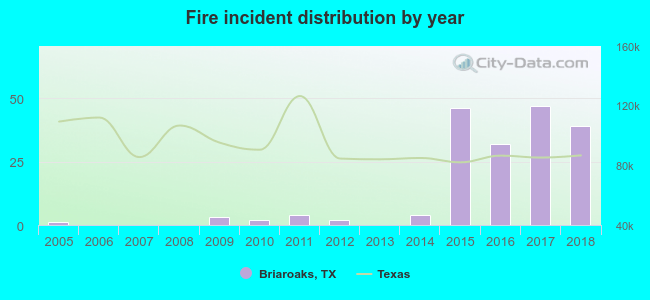 According to the data from the years 2005 - 2018 the average number of fire incidents per year is 13. The highest number of fire incidents - 47 took place in 2017, and the least - 0 in 2006. The data has a rising trend.
 25.6% incidents where reported in the morning and 74.4% in the evening. The most fires (22.8%) took place on Thursday, and the least (5.6%) on Sunday.
 Based on the 180 fires from years 2005 - 2018 most fires (15.6%) took place during May, and the least (4.4%) in November.
 Out of all 1,114 cases reported during the years 2005 - 2018, the most belonged to the categories: Overpressure Rupture (46.0%), Service Call (30.9%), and Fire (16.2%).
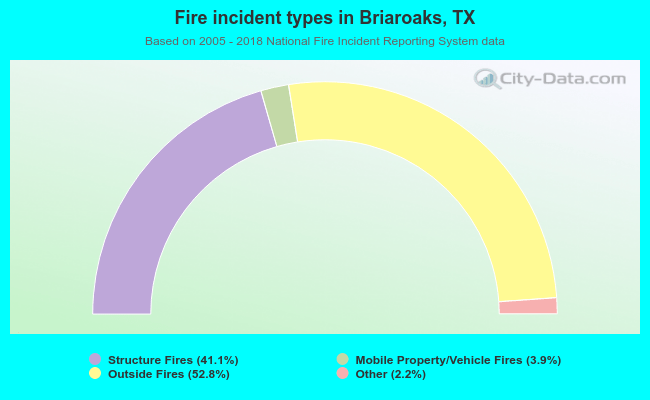 When looking into fire subcategories, the most incidents belonged to: Outside Fires (52.8%), and Structure Fires (41.1%).