Brighton: Fire Incidents, Michigan (MI)
Where are fire incidents reported in Brighton, MI
Something went wrong! Please refresh the page.
| Fire incidents reported | |
|---|---|
| Sreet name | Count |
| GRAND RIVER AVE | 258 |
| GRAND RIVER | 158 |
| I96 | 98 |
| I-96 | 90 |
| WHITMORE LAKE RD | 80 |
| RICKETT RD | 64 |
| KENSINGTON RD | 48 |
| OLD US 23 | 48 |
| LEE RD | 42 |
| US23 | 38 |
| CHALLIS RD | 36 |
| BAUER RD | 34 |
| KENSINGTON CT | 34 |
| HACKER RD | 32 |
| OLD US23 | 30 |
| HAMBURG RD | 28 |
| HYNE RD | 28 |
| VILLAGE PLACE BLVD | 28 |
| FIELDCREST RD | 26 |
| US-23 | 26 |
| US-23 EXPY | 26 |
| MALTBY RD | 24 |
| BISHOP RD | 22 |
| HUGHES RD | 22 |
| MCCLEMENTS RD | 22 |
| PLEASANT VALLEY RD | 22 |
| SPENCER RD | 22 |
| US23 EXPY | 22 |
| RICKETT | 20 |
| SPICER RD | 20 |
| Other | 866 |
2002 - 2018 National Fire Incident Reporting System (NFIRS) incidents
- Incident types reported to NFIRS in Brighton, MI
- 6,29238.8%Rescue & EMS
- 3,21219.8%Hazardous Condition
- 2,31414.3%Fire
- 1,92211.8%Good Intent Call
- 1,2107.5%False Alarm
- 1,1787.3%Service Call
- 690.4%Severe Weather
- 170.1%Overpressure Rupture
- Fire incident types reported to NFIRS in Brighton, MI
- 1,09047.1%Structure Fires
- 67329.1%Outside Fires
- 49321.3%Mobile Property/Vehicle Fires
- 582.5%Other
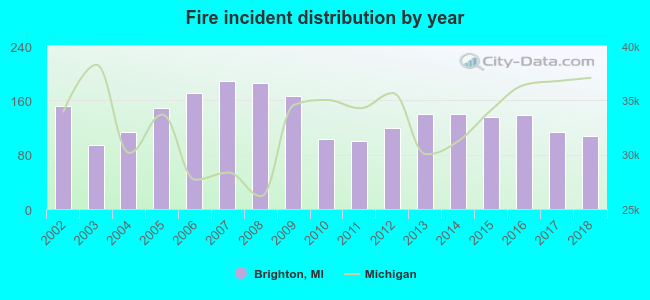 According to the data from the years 2002 - 2018 the average number of fire incidents per year is 136. The highest number of reported fires - 189 took place in 2007, and the least - 94 in 2003. The data has a decreasing trend.
The average number of yearly fire incidents per 10k residents in Brighton, MI compared to nearest cities:
(Note: Based on data for the last 3 years, including only cities with population 5,000 and above)
| Brighton: | 156.3 |
| Whitmore Lake: | 81.0 |
| South Lyon: | 54.9 |
| Howell: | 162.9 |
| Milford: | 53.1 |
| Wixom: | 23.8 |
| Walled Lake: | 32.3 |
| Novi: | 17.0 |
| Northville: | 96.4 |
 The median response time based on all reported fire incidents is 8 minutes. This is higher compared to the state median value.
The median response time in Brighton, MI compared to nearest cities:
(Note: Based on data for all years, including only cities with at least 500 fire incidents)
| Brighton: | 8 minutes |
| Whitmore Lake: | 8 minutes |
| South Lyon: | 7 minutes |
| Pinckney: | 8 minutes |
| Howell: | 8 minutes |
| Wixom: | 9 minutes |
| Dexter: | 8 minutes |
| Novi: | 6 minutes |
| Northville: | 7 minutes |
 According to the data from the years 2002 - 2018 the average number of fire-related fatalities per year is 0. The highest number of reported deaths - 2 took place in 2016, and the lowest - 0 in 2003. The data has a dropping trend.
 Based on the data from the years 2002 - 2018 the average number of fire-related casualties per year is 1. The highest number of injuries - 4 took place in 2002, and the lowest - 0 in 2003. The data has a decreasing trend.
The average number of casualties per 1,000 fire incidents is 7. This indicator was the highest - 26 in 2002, and the lowest 0 in 2003. The trend for injuries per 1,000 fires is declining. Compared to the Michigan value the number of injuries per 1,000 incidents is lower.
Based on the data from the years 2002 - 2018 the average number of fire-related casualties per year is 1. The highest number of injuries - 4 took place in 2002, and the lowest - 0 in 2003. The data has a decreasing trend.
The average number of casualties per 1,000 fire incidents is 7. This indicator was the highest - 26 in 2002, and the lowest 0 in 2003. The trend for injuries per 1,000 fires is declining. Compared to the Michigan value the number of injuries per 1,000 incidents is lower.Casualties per 1,000 incidents in Brighton, MI compared to nearest cities:
(Note: Based on data for all years, including only cities with at least 500 fire incidents)
| Brighton: | 7.3 |
| Whitmore Lake: | 3.7 |
| South Lyon: | 7.6 |
| Pinckney: | 3.3 |
| Howell: | 20.2 |
| Wixom: | 1.9 |
| Dexter: | 2.7 |
| Novi: | 33.3 |
| Northville: | 16.0 |
 32.7% incidents where reported in the morning and 67.3% in the evening. The most fires (16.0%) took place on Sunday, and the least (12.0%) on Wednesday.
 According to the 2,314 incident reports from years 2002 - 2018 most fires (13.0%) took place during April, and the least (5.7%) in September.
 Out of all 16,223 cases reported during the years 2002 - 2018, the most belonged to the categories: Rescue & EMS (38.8%), Hazardous Condition (19.8%), and Fire (14.3%).
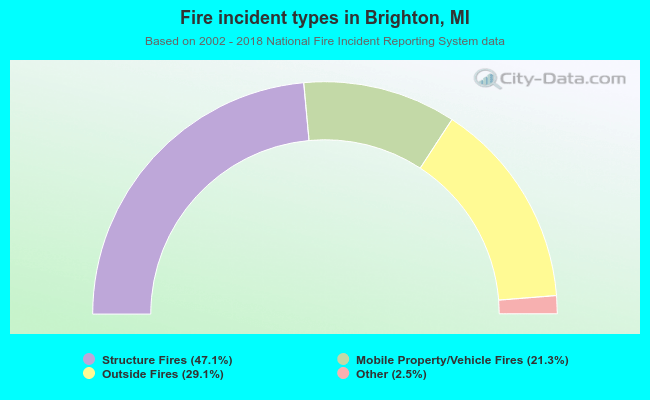 When looking into fire subcategories, the most reports belonged to: Structure Fires (47.1%), and Outside Fires (29.1%).