Brooklawn: Fire Incidents, New Jersey (NJ)
Where are fire incidents reported in Brooklawn, NJ
Something went wrong! Please refresh the page.
|
| |||||||||||||||||||||||||||||||||||||||||||||||||||||||||||||||||||||||||||||||||||||||||||||||||||||||||||||
2002 - 2018 National Fire Incident Reporting System (NFIRS) incidents
- Incident types reported to NFIRS in Brooklawn, NJ
- 30331.9%Hazardous Condition
- 20521.6%Fire
- 18819.8%False Alarm
- 10511.1%Rescue & EMS
- 818.5%Service Call
- 626.5%Good Intent Call
- 30.3%Special Incident
- 20.2%Severe Weather
- 10.1%Overpressure Rupture
- Fire incident types reported to NFIRS in Brooklawn, NJ
- 10249.8%Structure Fires
- 6632.2%Outside Fires
- 2411.7%Mobile Property/Vehicle Fires
- 136.3%Other
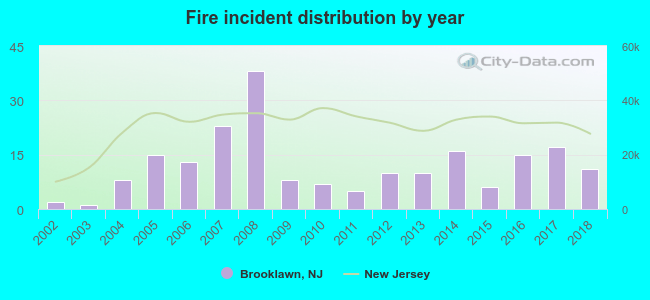 Based on the data from the years 2002 - 2018 the average number of fire incidents per year is 12. The highest number of reported fire incidents - 38 took place in 2008, and the least - 1 in 2003. The data has an increasing trend.
 26.3% incidents where reported in the morning and 73.7% in the evening. The most fires (16.1%) took place on Wednesday, and the least (11.7%) on Tuesday.
 Based on the 205 fires from years 2002 - 2018 most fires (14.1%) took place during April, and the least (5.9%) in June.
 Out of all 950 cases reported during the years 2002 - 2018, the most belonged to the categories: Hazardous Condition (31.9%), Fire (21.6%), and False Alarm (19.8%).
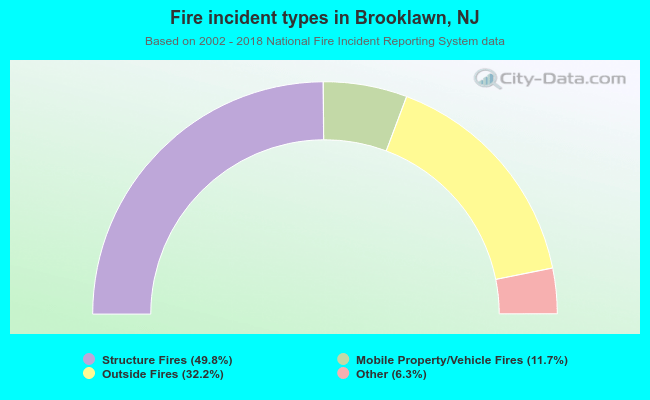 When looking into fire subcategories, the most incidents belonged to: Structure Fires (49.8%), and Outside Fires (32.2%).