| Fire incidents reported |
|---|
| Sreet name | Count |
|---|
| 932 NEW ZION RD | 6 | | BELMONT RD | 6 | | HAMILTON RD | 6 | | 1053 STUMP RD | 4 | | 1370 MATTOX RD | 4 | | 1523 HAMILTON RD | 4 | | 1776 AUGUSTA BERLIN RD | 4 | | 2042 PERKINS RIDGE | 4 | | 2091 WAGEL RD | 4 | | 2095 B'VILLE P'VILLE RD | 4 | | 2107 BLADESTON DR | 4 | | 211 ELIZABETH ST | 4 | | 240 WOODLAND ACRES | 4 | | 2678 BELMONT RD | 4 | | 2880 WESTERN HILLS RD | 4 | | 2904 BLADESTON DR | 4 | | 3081 P'VILLE HARRISON | 4 | | 653 WILLOW LENOXBURG RD | 4 | | 884 NEAVE RIDGE | 4 | | AUGUSTA BERLIN RD | 4 | | BELMONT RD | 4 | | BROOKSVILLE GERMANTOWN RD | 4 | | CUMMINSVILLE BERLIN RD | 4 | | DELANEY RD | 4 | | DOUBLE A HWY | 4 |
| | | Fire incidents reported |
|---|
| Sreet name | Count |
|---|
| FEAGAN RIDGE | 4 | | GARRETT AVE | 4 | | HALEY RDG | 4 | | HWY 165 | 4 | | HWY 19 | 4 | | PARINA RD | 4 | | SALEM RIDGE | 4 | | 0 UPPER WILLOW CR | 2 | | 100 ELIZABETH ST | 2 | | 1007 MINI FARMS RD. | 2 | | 101 HWY 19 | 2 | | 1011 SPARKS RD. | 2 | | 1019 AA HWY | 2 | | 1040 FRONKS LANE | 2 | | 105 LOCUST STREET | 2 | | 106 JENKINS ALLEY | 2 | | 1062 MATTOX RD | 2 | | 1076 BROOKSVILLE POWERSVILLE R | 2 | | 1078 HAMILTON RD | 2 | | 1091 BELMONT RD | 2 | | 110 LINCOLN AVE | 2 | | 111 AUGUSTA BERLIN RD | 2 | | 1111 BROWNINGS CORNER | 2 | | 112 GIBSON DR | 2 | | 1143 POWERSVILLE WILLOW RD | 2 |
|
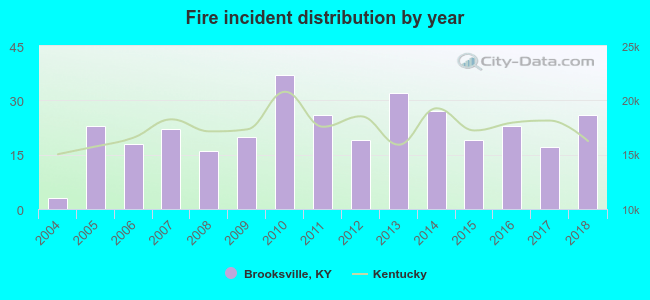 According to the data from the years 2004 - 2018 the average number of fire incidents per year is 22. The highest number of reported fire incidents - 37 took place in 2010, and the least - 3 in 2004. The data has a rising trend.
 36.5% incidents where reported in the morning and 63.5% in the evening. The most fires (18.8%) took place on Saturday, and the least (9.4%) on Wednesday.
 Based on the 329 fire incident reports from years 2004 - 2018 most fires (13.4%) took place during March, and the least (4.9%) in February.
 Out of all 643 cases reported during the years 2004 - 2018, the most belonged to the categories: Fire (51.2%), Rescue & EMS (26.0%), and Hazardous Condition (9.5%).
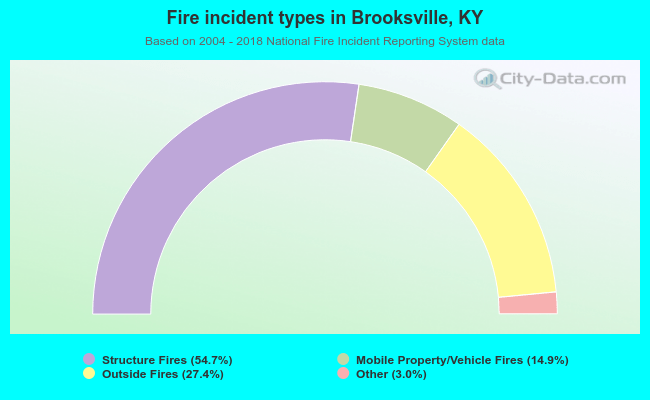 When looking into fire subcategories, the most reports belonged to: Structure Fires (54.7%), and Outside Fires (27.4%).