Buchanan: Fire Incidents, Michigan (MI)
Where are fire incidents reported in Buchanan, MI
Something went wrong! Please refresh the page.
|
| |||||||||||||||||||||||||||||||||||||||||||||||||||||||||||||||||||||||||||||||||||||||||||||||||||||||||||||
| Other | 84 | |||||||||||||||||||||||||||||||||||||||||||||||||||||||||||||||||||||||||||||||||||||||||||||||||||||||||||||
2002 - 2018 National Fire Incident Reporting System (NFIRS) incidents
- Incident types reported to NFIRS in Buchanan, MI
- 74838.6%Fire
- 62032.0%Hazardous Condition
- 1849.5%Service Call
- 1407.2%Good Intent Call
- 1306.7%False Alarm
- 934.8%Rescue & EMS
- 100.5%Severe Weather
- 90.5%Special Incident
- 60.3%Overpressure Rupture
- Fire incident types reported to NFIRS in Buchanan, MI
- 41255.1%Structure Fires
- 22930.6%Outside Fires
- 7810.4%Mobile Property/Vehicle Fires
- 293.9%Other
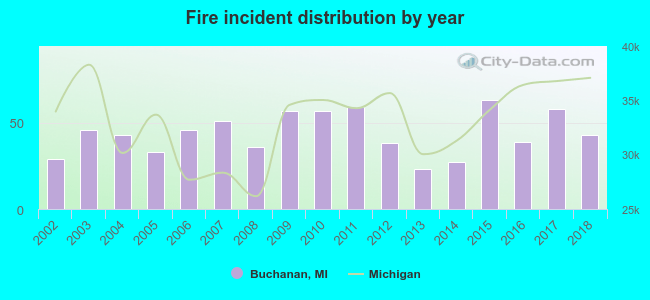 According to the data from the years 2002 - 2018 the average number of fire incidents per year is 44. The highest number of reported fires - 63 took place in 2015, and the least - 23 in 2013. The data has an increasing trend.
 The median response time based on all reported fire incidents is 9 minutes. This is higher compared to the state median value.
The median response time in Buchanan, MI compared to nearest cities:
(Note: Based on data for all years, including only cities with at least 500 fire incidents)
| Buchanan: | 9 minutes |
| Niles: | 6 minutes |
| Berrien Springs: | 10 minutes |
| Notre Dame: | 2 minutes |
| South Bend: | 5 minutes |
| Granger: | 6 minutes |
| Edwardsburg: | 11 minutes |
| Mishawaka: | 5 minutes |
| Dowagiac: | 8 minutes |
 27.9% incidents where reported in the morning and 72.1% in the evening. The most fires (19.0%) took place on Monday, and the least (10.7%) on Thursday.
 According to the 748 fire incident reports from years 2002 - 2018 most fires (12.2%) took place during April, and the least (4.8%) in September.
 Out of all 1,940 cases reported during the years 2002 - 2018, the most belonged to the categories: Fire (38.6%), Hazardous Condition (32.0%), and Service Call (9.5%).
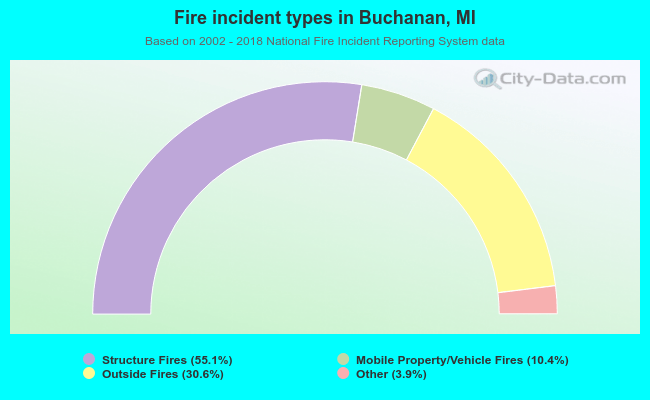 When looking into fire subcategories, the most incidents belonged to: Structure Fires (55.1%), and Outside Fires (30.6%).