Bucoda: Fire Incidents, Washington (WA)
Where are fire incidents reported in Bucoda, WA
Something went wrong! Please refresh the page.
|
| |||||||||||||||||||||||||||||||||||||||||||||||||||||||||||||||||||||||||||||||||||||||||||||||||||||||||||||
2003 - 2018 National Fire Incident Reporting System (NFIRS) incidents
- Incident types reported to NFIRS in Bucoda, WA
- 32457.8%Rescue & EMS
- 11420.3%Fire
- 6511.6%Good Intent Call
- 285.0%Hazardous Condition
- 234.1%Service Call
- 61.1%False Alarm
- 10.2%Severe Weather
- Fire incident types reported to NFIRS in Bucoda, WA
- 5750.0%Structure Fires
- 4136.0%Outside Fires
- 87.0%Mobile Property/Vehicle Fires
- 87.0%Other
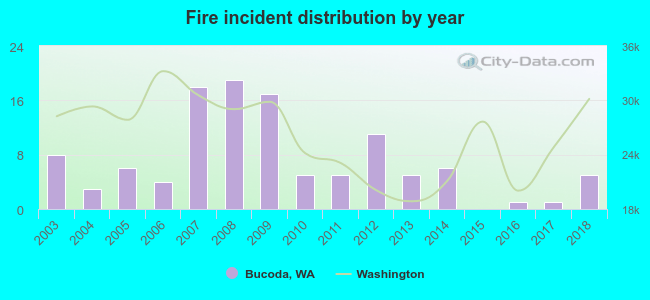 According to the data from the years 2003 - 2018 the average number of fires per year is 7. The highest number of fires - 19 took place in 2008, and the least - 0 in 2015. The data has a decreasing trend.
 25.4% incidents where reported in the morning and 74.6% in the evening. The most fires (28.1%) took place on Friday, and the least (7.9%) on Monday.
 Based on the 114 fire incident reports from years 2003 - 2018 most fires (14.9%) took place during July, and the least (3.5%) in September.
 Out of all 561 cases reported during the years 2003 - 2018, the most belonged to the categories: Overpressure Rupture (57.8%), Fire (20.3%), and Service Call (11.6%).
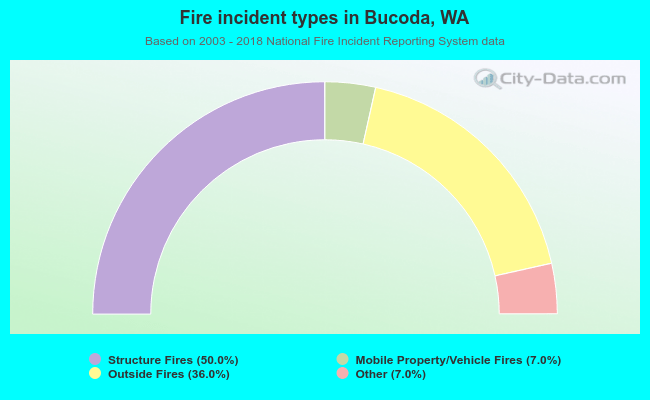 When looking into fire subcategories, the most incidents belonged to: Structure Fires (50.0%), and Outside Fires (36.0%).