Buffalo: Fire Incidents, Wyoming (WY)
Where are fire incidents reported in Buffalo, WY
Something went wrong! Please refresh the page.
|
| |||||||||||||||||||||||||||||||||||||||||||||||||||||||||||||||||||||||||||||||||||||||||||||||||||||||||||||
| Other | 168 | |||||||||||||||||||||||||||||||||||||||||||||||||||||||||||||||||||||||||||||||||||||||||||||||||||||||||||||
2002 - 2018 National Fire Incident Reporting System (NFIRS) incidents
- Incident types reported to NFIRS in Buffalo, WY
- 40444.2%Fire
- 27229.7%Hazardous Condition
- 9610.5%Rescue & EMS
- 758.2%Good Intent Call
- 394.3%False Alarm
- 192.1%Service Call
- 70.8%Overpressure Rupture
- 30.3%Special Incident
- Fire incident types reported to NFIRS in Buffalo, WY
- 22655.9%Outside Fires
- 9122.5%Mobile Property/Vehicle Fires
- 5814.4%Structure Fires
- 297.2%Other
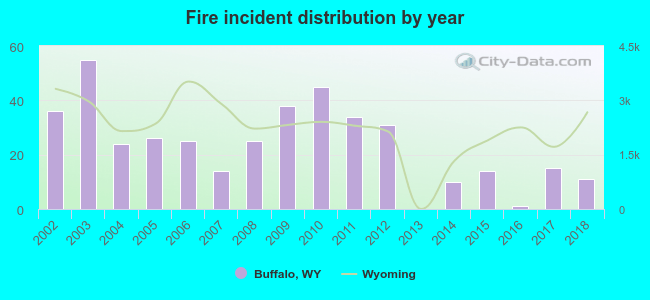 According to the data from the years 2002 - 2018 the average number of fires per year is 24. The highest number of reported fire incidents - 55 took place in 2003, and the least - 0 in 2013. The data has a dropping trend.
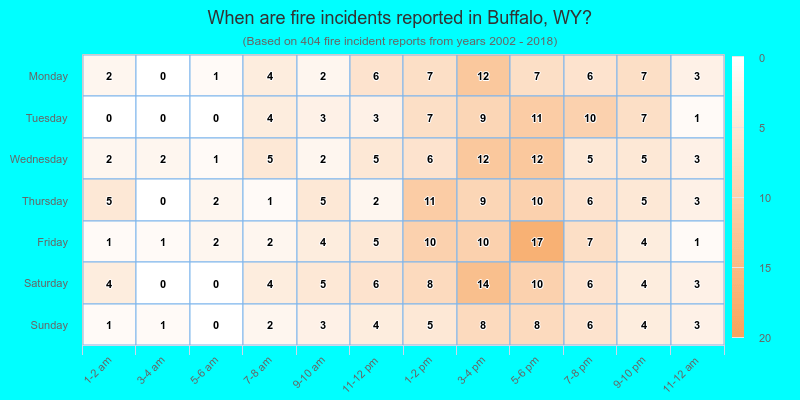
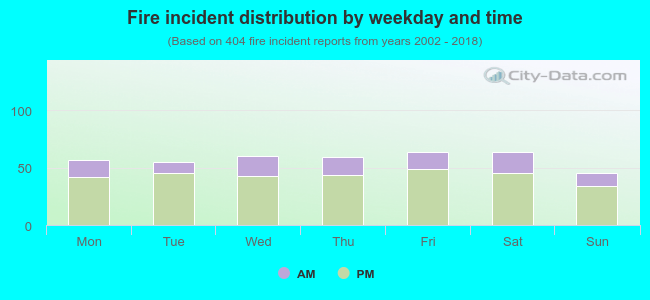 25.2% incidents where reported in the morning and 74.8% in the evening. The most fires (15.8%) took place on Friday, and the least (11.1%) on Sunday.
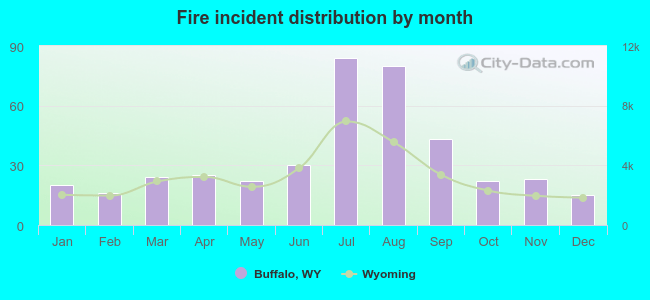 Based on the 404 fire incidents from years 2002 - 2018 most fires (20.8%) took place during July, and the least (3.7%) in December.
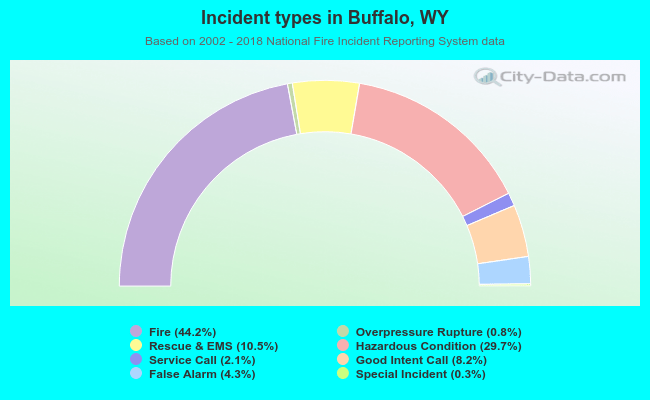 Out of all 915 cases reported during the years 2002 - 2018, the most belonged to the categories: Fire (44.2%), Hazardous Condition (29.7%), and Rescue & EMS (10.5%).
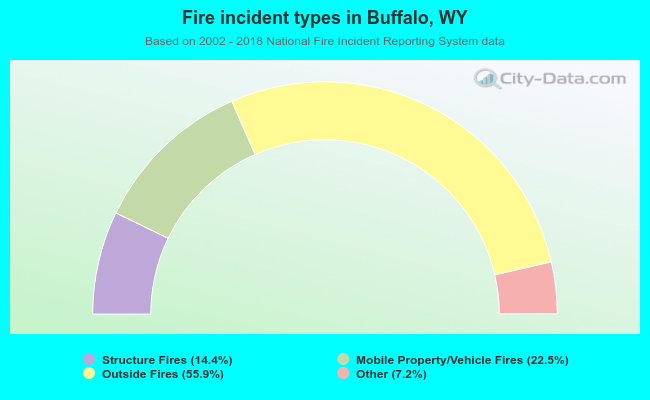 When looking into fire subcategories, the most incidents belonged to: Outside Fires (55.9%), and Mobile Property/Vehicle Fires (22.5%).