Burlington: Fire Incidents, Illinois (IL)
Where are fire incidents reported in Burlington, IL
Something went wrong! Please refresh the page.
|
| |||||||||||||||||||||||||||||||||||||||||||||||||||||||||||||||||||||||||||||||||||||||||||||||||||||||||||||
2002 - 2018 National Fire Incident Reporting System (NFIRS) incidents
- Incident types reported to NFIRS in Burlington, IL
- 31736.7%Rescue & EMS
- 28332.8%Fire
- 9711.2%Good Intent Call
- 718.2%Service Call
- 606.9%Hazardous Condition
- 293.4%False Alarm
- 50.6%Severe Weather
- 10.1%Overpressure Rupture
- 10.1%Special Incident
- Fire incident types reported to NFIRS in Burlington, IL
- 18063.6%Structure Fires
- 8530.0%Outside Fires
- 155.3%Mobile Property/Vehicle Fires
- 31.1%Other
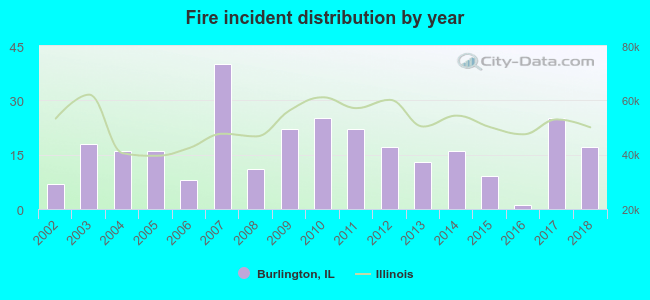 According to the data from the years 2002 - 2018 the average number of fire incidents per year is 17. The highest number of reported fire incidents - 40 took place in 2007, and the least - 1 in 2016. The data has a growing trend.
 28.6% incidents where reported in the morning and 71.4% in the evening. The most fires (19.4%) took place on Saturday, and the least (8.5%) on Wednesday.
 According to the 283 fire incident reports from years 2002 - 2018 most fires (15.5%) took place during April, and the least (3.9%) in September.
 Out of all 864 cases reported during the years 2002 - 2018, the most belonged to the categories: Rescue & EMS (36.7%), Fire (32.8%), and Good Intent Call (11.2%).
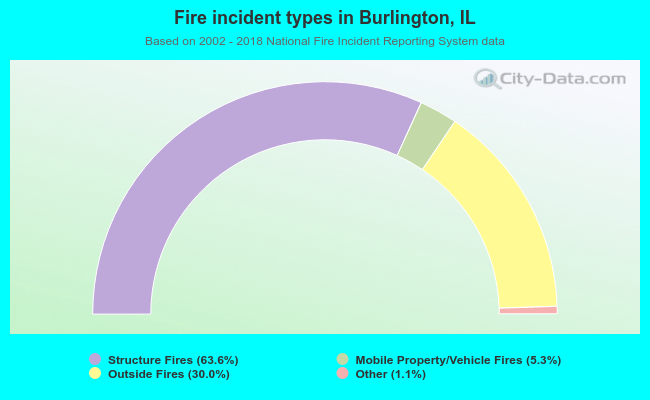 When looking into fire subcategories, the most reports belonged to: Structure Fires (63.6%), and Outside Fires (30.0%).