Burns: Fire Incidents, Wyoming (WY)
Where are fire incidents reported in Burns, WY
Something went wrong! Please refresh the page.
|
| |||||||||||||||||||||||||||||||||||||||||||||||||||||||||||||||||||||||||||||||||||||||||||||||||||||||||||||
2002 - 2018 National Fire Incident Reporting System (NFIRS) incidents
- Incident types reported to NFIRS in Burns, WY
- 20938.2%Fire
- 20136.7%Rescue & EMS
- 7213.2%Good Intent Call
- 417.5%Hazardous Condition
- 91.6%Service Call
- 61.1%False Alarm
- 61.1%Special Incident
- 20.4%Overpressure Rupture
- 10.2%Severe Weather
- Fire incident types reported to NFIRS in Burns, WY
- 11354.1%Outside Fires
- 4823.0%Structure Fires
- 3918.7%Mobile Property/Vehicle Fires
- 94.3%Other
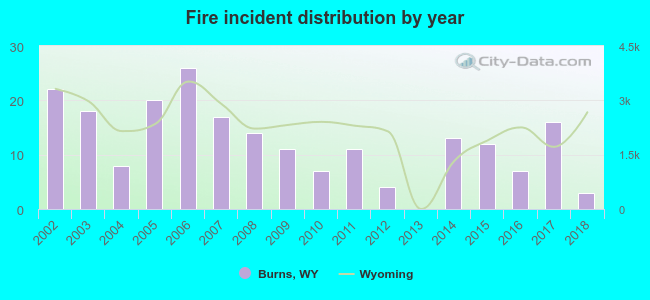 According to the data from the years 2002 - 2018 the average number of fires per year is 12. The highest number of reported fire incidents - 26 took place in 2006, and the least - 0 in 2013. The data has a dropping trend.
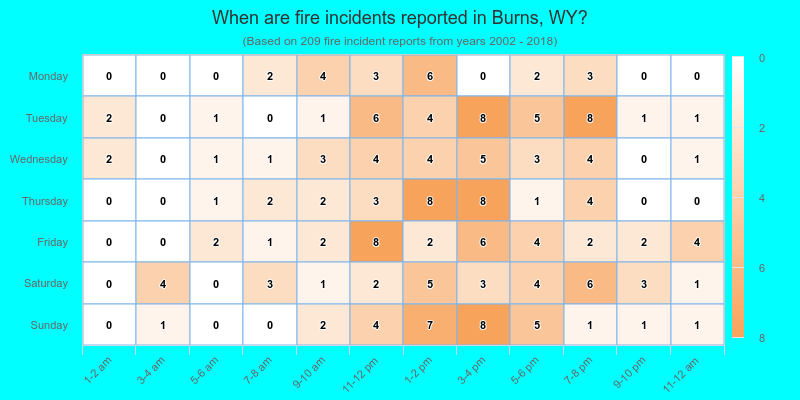
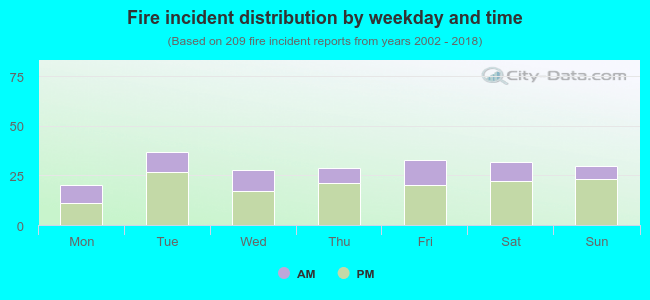 32.5% incidents where reported in the morning and 67.5% in the evening. The most fires (17.7%) took place on Tuesday, and the least (9.6%) on Monday.
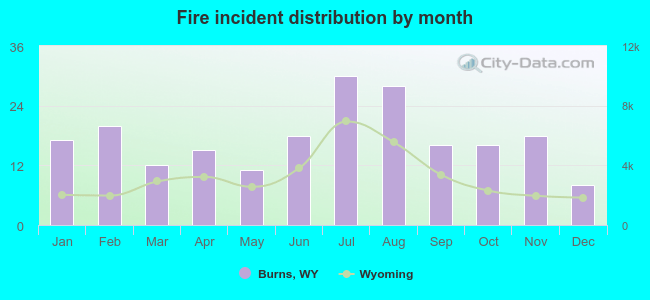 Based on the 209 fire incidents from years 2002 - 2018 most fires (14.4%) took place during July, and the least (3.8%) in December.
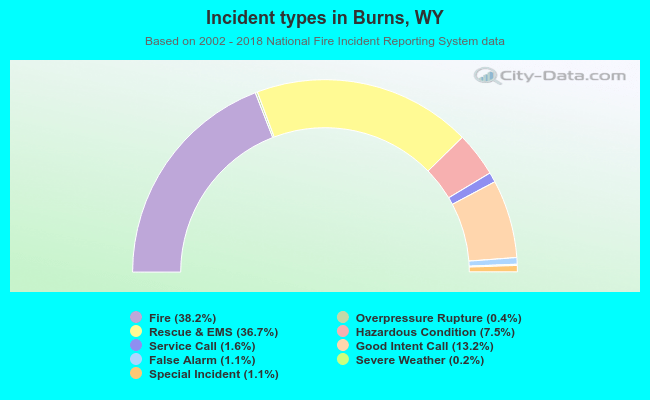 Out of all 547 cases reported during the years 2002 - 2018, the most belonged to the categories: Fire (38.2%), Rescue & EMS (36.7%), and Good Intent Call (13.2%).
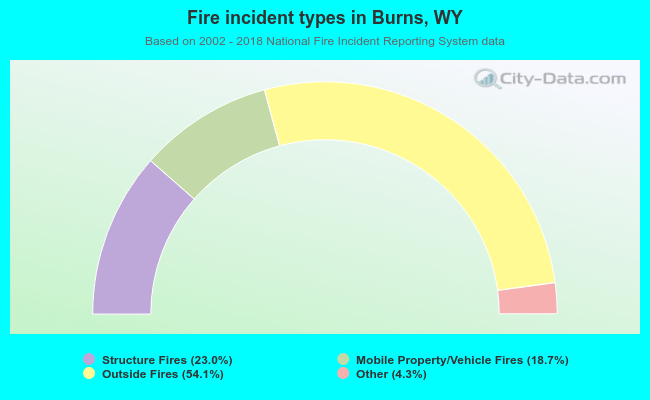 When looking into fire subcategories, the most incidents belonged to: Outside Fires (54.1%), and Structure Fires (23.0%).