| Fire incidents reported |
|---|
| Sreet name | Count |
|---|
| LAKESHORE DR | 16 | | ANTIOCH CHURCH RD | 12 | | ANTIOCH AVE | 8 | | FOXWOOD DR | 8 | | STONEGATE DR | 8 | | 27 HWY | 6 | | BRIARWOOD DR | 6 | | TANGLEWOOD DR | 6 | | 1690 ANTIOCH CHURCH ROAD | 4 | | 177 CORDELL DRIVE | 4 | | 27 | 4 | | 27 HIGH | 4 | | 90 HWY | 4 | | ANTIOCH LN | 4 | | ANTIOCH RD | 4 | | CORDELL DR | 4 | | HWY 27 | 4 | | MILLER DR | 4 | | WHITE LN | 4 | | 10 IMPALA DRIVE | 2 | | 100 STONEGATE DRIVE | 2 | | 110 LAKE SHORE ANTIOCH | 2 | | 123 POPALUR AVE. | 2 | | 1247 HWY | 2 | | 128 SIERRIA DRIVE | 2 |
| | | Fire incidents reported |
|---|
| Sreet name | Count |
|---|
| 1590 LAKESHORE/PINE DR | 2 | | 201 E. ANTIOCH AVE | 2 | | 213 PERKINS DR | 2 | | 219 EARL NEALLY RD | 2 | | 340 PERKINS DRIVE | 2 | | 357 EDGEWATER RD | 2 | | 405 DEAD OX HOLLOW RD | 2 | | 484 CLIFFSIDE DRIVE | 2 | | 8042 SOUTH MAIN STREET | 2 | | 824 ANTIOCH CHURCH RD | 2 | | 84 MILLER DRIVE | 2 | | 8745 S HWY 27 | 2 | | 94 BRAY LN | 2 | | ANITIOCH CHURCH RD | 2 | | ANTIOCH LANE | 2 | | ANTIOCH LN / CORDALL DR. | 2 | | ANTIOCH ROAD | 2 | | ANTIOCH SHORES | 2 | | BEND OF LAKES RD | 2 | | BLUE JOHN DR | 2 | | BRIARWOOD DR & FOXBOROUGH CT | 2 | | CEDAR GROVE RD | 2 | | CEDAR GROVE ROAD | 2 | | CENTRAL AVE | 2 | | CHARLES VANHOOK RD | 2 |
|
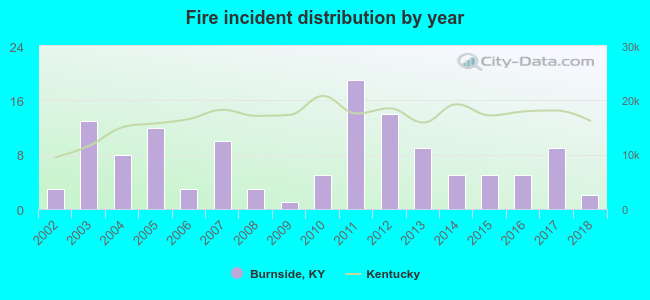 Based on the data from the years 2002 - 2018 the average number of fire incidents per year is 7. The highest number of fires - 19 took place in 2011, and the least - 1 in 2009. The data has a decreasing trend.
 34.9% incidents where reported in the morning and 65.1% in the evening. The most fires (19.0%) took place on Wednesday, and the least (10.3%) on Tuesday.
 Based on the 126 reports from years 2002 - 2018 most fires (15.1%) took place during July, and the least (4.8%) in May.
 Out of all 151 cases reported during the years 2002 - 2018, the most belonged to the categories: Fire (83.4%), Service Call (9.3%), and Overpressure Rupture (4.6%).
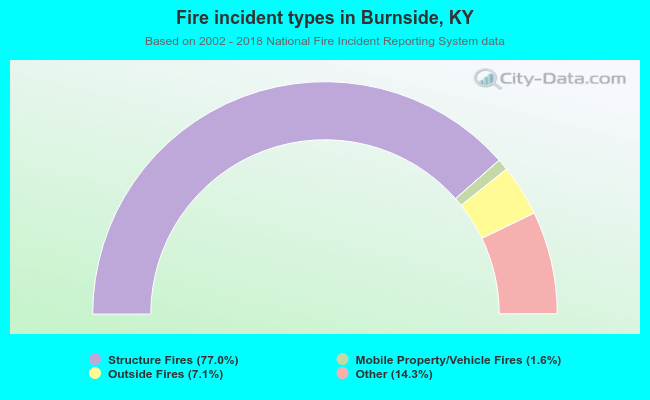 When looking into fire subcategories, the most incidents belonged to: Structure Fires (77.0%), and Other (14.3%).