Caldwell: Fire Incidents, New Jersey (NJ)
Where are fire incidents reported in Caldwell, NJ
Something went wrong! Please refresh the page.
|
| |||||||||||||||||||||||||||||||||||||||||||||||||||||||||||||||||||||||||||||||||||||||||||||||||||||||||||||
2005 - 2018 National Fire Incident Reporting System (NFIRS) incidents
- Incident types reported to NFIRS in Caldwell, NJ
- 68046.1%Hazardous Condition
- 41728.3%False Alarm
- 20013.6%Fire
- 1026.9%Service Call
- 412.8%Good Intent Call
- 201.4%Rescue & EMS
- 120.8%Overpressure Rupture
- 20.1%Severe Weather
- Fire incident types reported to NFIRS in Caldwell, NJ
- 12160.5%Structure Fires
- 6030.0%Outside Fires
- 157.5%Mobile Property/Vehicle Fires
- 42.0%Other
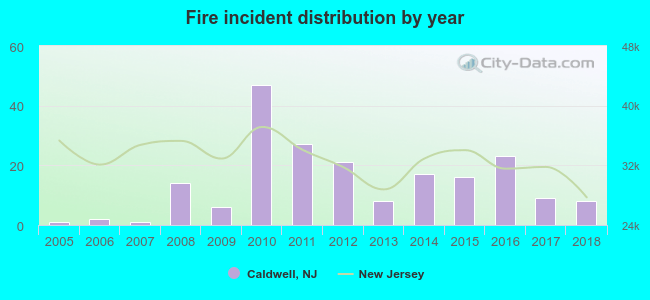 Based on the data from the years 2005 - 2018 the average number of fire incidents per year is 14. The highest number of reported fire incidents - 47 took place in 2010, and the least - 1 in 2005. The data has a growing trend.
The average number of yearly fire incidents per 10k residents in Caldwell, NJ compared to nearest cities:
(Note: Based on data for the last 3 years, including only cities with population 5,000 and above)
| Caldwell: | 18.1 |
| West Caldwell: | 32.1 |
| Verona: | 1.9 |
| North Caldwell: | 9.3 |
| Roseland: | 34.3 |
| Cedar Grove: | 13.1 |
| Fairfield: | 65.1 |
| Montclair: | 14.4 |
| West Orange: | 32.6 |

 27.0% incidents where reported in the morning and 73.0% in the evening. The most fires (18.5%) took place on Thursday, and the least (10.5%) on Wednesday.
 Based on the 200 reports from years 2005 - 2018 most fires (12.5%) took place during January, and the least (6.0%) in February.
 Out of all 1,474 cases reported during the years 2005 - 2018, the most belonged to the categories: Hazardous Condition (46.1%), False Alarm (28.3%), and Fire (13.6%).
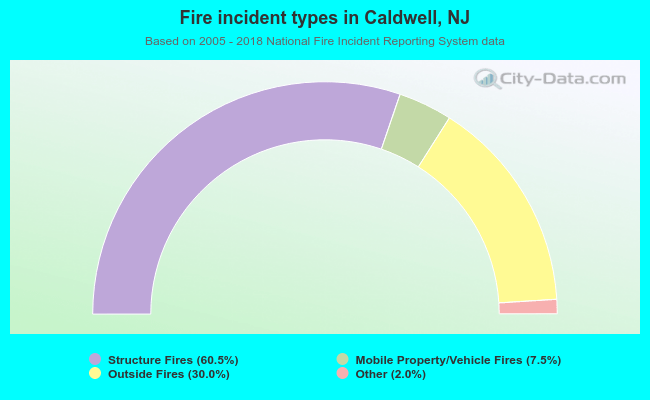 When looking into fire subcategories, the most reports belonged to: Structure Fires (60.5%), and Outside Fires (30.0%).