| Fire incidents reported |
|---|
| Sreet name | Count |
|---|
| MARY INGLES HWY | 36 | | FLAGG SPRINGS PIKE | 26 | | WASHINGTON TRACE RD | 26 | | CALIFORNIA CROSSROADS | 18 | | AA HWY | 12 | | SMITH RD | 12 | | BURNS RD | 8 | | NEW RICHMOND RD | 8 | | WESLEY CHAPEL RD | 8 | | CARTHAGE RD | 6 | | PEACH GROVE (HWY 154) RD | 6 | | SUMMER HILL RD | 6 | | TRUESDELL RD | 6 | | DANIELS RD | 4 | | LICK HILL RD | 4 | | MADISON ST | 4 | | MAKENA LANE | 4 | | ROUTE 10 HWY | 4 | | SHORT CUT ROAD | 4 | | WASHINGTON ST | 4 | | WASHINGTON TRACE | 4 | | WISH RD | 4 | | 12881 WESLEY CHAPEL | 2 | | 1700 DECKER RD | 2 | | 17714 HWY 10 N | 2 |
| | | Fire incidents reported |
|---|
| Sreet name | Count |
|---|
| 343 BARKER | 2 | | 3520 IVOR RD | 2 | | 360 FARDO RD | 2 | | 4018 WASHINGTON ST | 2 | | 7315 HWY 154 | 2 | | 80 MAYS RD | 2 | | 872 LITTLE PLUMBER | 2 | | AA | 2 | | AA HWY AT BAKER RD | 2 | | BARKER | 2 | | BARKER RD | 2 | | BARKER RD | 2 | | BOB WHITE LANE | 2 | | DEAD TIMBER | 2 | | DEAD TIMBER NO. 1 RD | 2 | | DEAD TIMBER RD | 2 | | FARDO LN | 2 | | HWY 8 | 2 | | IVOR RD | 2 | | KOEHLER RD | 2 | | KY ROUTE 10 HWY | 2 | | LICK HILL | 2 | | MAIN ST | 2 | | MARY INGLES | 2 | | |
|
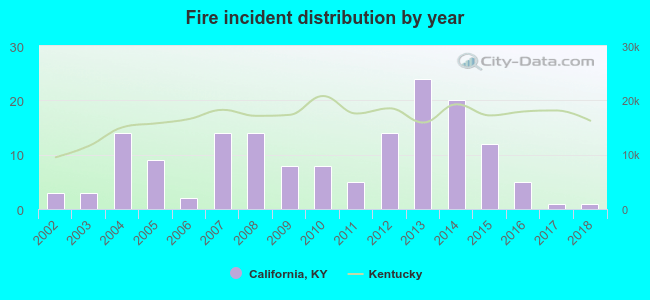 Based on the data from the years 2002 - 2018 the average number of fire incidents per year is 9. The highest number of fires - 24 took place in 2013, and the least - 1 in 2017. The data has a decreasing trend.
 20.4% incidents where reported in the morning and 79.6% in the evening. The most fires (21.0%) took place on Tuesday, and the least (11.5%) on Saturday.
 Based on the 157 reports from years 2002 - 2018 most fires (13.4%) took place during February, and the least (3.8%) in May.
 Out of all 567 cases reported during the years 2002 - 2018, the most belonged to the categories: Overpressure Rupture (29.5%), Fire (27.7%), and Rescue & EMS (18.7%).
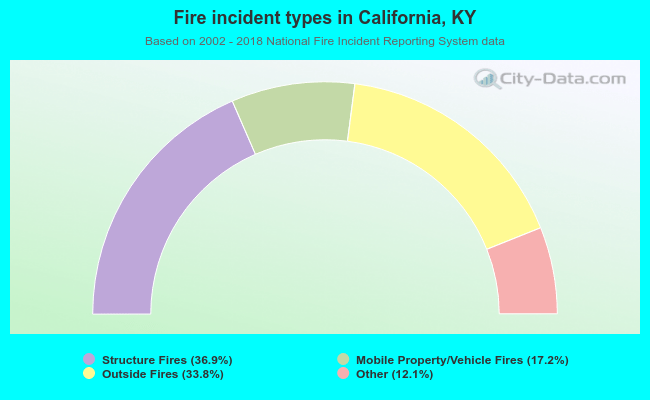 When looking into fire subcategories, the most incidents belonged to: Structure Fires (36.9%), and Outside Fires (33.8%).