Campbellton: Fire Incidents, Florida (FL)
Where are fire incidents reported in Campbellton, FL
Something went wrong! Please refresh the page.
|
| |||||||||||||||||||||||||||||||||||||||||||||||||||||||||||||||||||||||||||||||||||||||||||||||||||||||||||||
| Other | 110 | |||||||||||||||||||||||||||||||||||||||||||||||||||||||||||||||||||||||||||||||||||||||||||||||||||||||||||||
2002 - 2018 National Fire Incident Reporting System (NFIRS) incidents
- Incident types reported to NFIRS in Campbellton, FL
- 42442.4%Fire
- 38638.6%Rescue & EMS
- 797.9%Hazardous Condition
- 414.1%False Alarm
- 363.6%Good Intent Call
- 212.1%Service Call
- 50.5%Severe Weather
- 50.5%Special Incident
- 40.4%Overpressure Rupture
- Fire incident types reported to NFIRS in Campbellton, FL
- 23054.2%Outside Fires
- 9823.1%Structure Fires
- 8319.6%Mobile Property/Vehicle Fires
- 133.1%Other
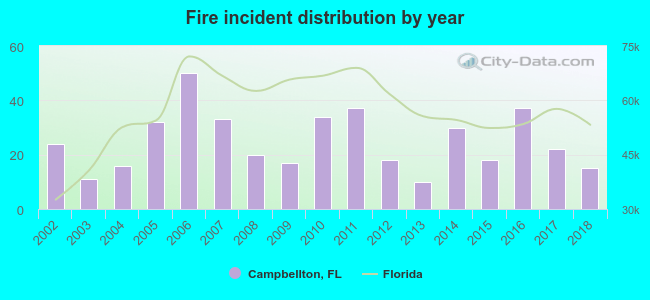 Based on the data from the years 2002 - 2018 the average number of fires per year is 25. The highest number of fires - 50 took place in 2006, and the least - 10 in 2013. The data has a dropping trend.
 27.8% incidents where reported in the morning and 72.2% in the evening. The most fires (17.9%) took place on Friday, and the least (11.1%) on Tuesday.
 According to the 424 fire incident reports from years 2002 - 2018 most fires (12.0%) took place during February, and the least (5.0%) in July.
 Out of all 1,001 cases reported during the years 2002 - 2018, the most belonged to the categories: Fire (42.4%), Rescue & EMS (38.6%), and Hazardous Condition (7.9%).
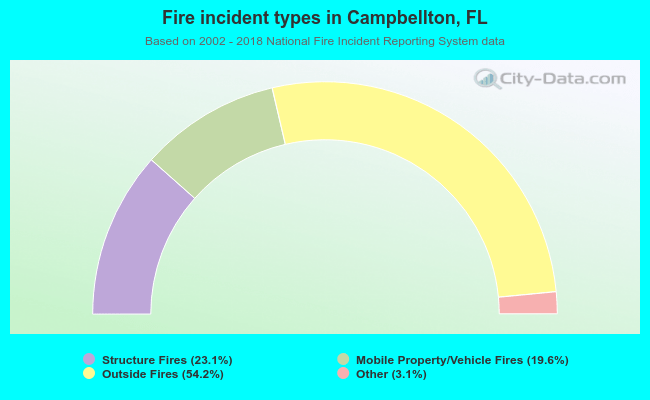 When looking into fire subcategories, the most reports belonged to: Outside Fires (54.2%), and Structure Fires (23.1%).